Telenor TVTnD Manager
About
In the Telenor DMS, the Telenor TVTnD Manager is in charge of customer devices diagnosis. Customer diagnosis input parameters are the customer ID, diagnosis period (start and end time), and response message language.
Diagnosis is performed on request. It is performed by the configurable DOM diagnosis configurations in the TVTnD Manager Configurator low-code app.
Results of the diagnosis are stored in three categories represented by tables:
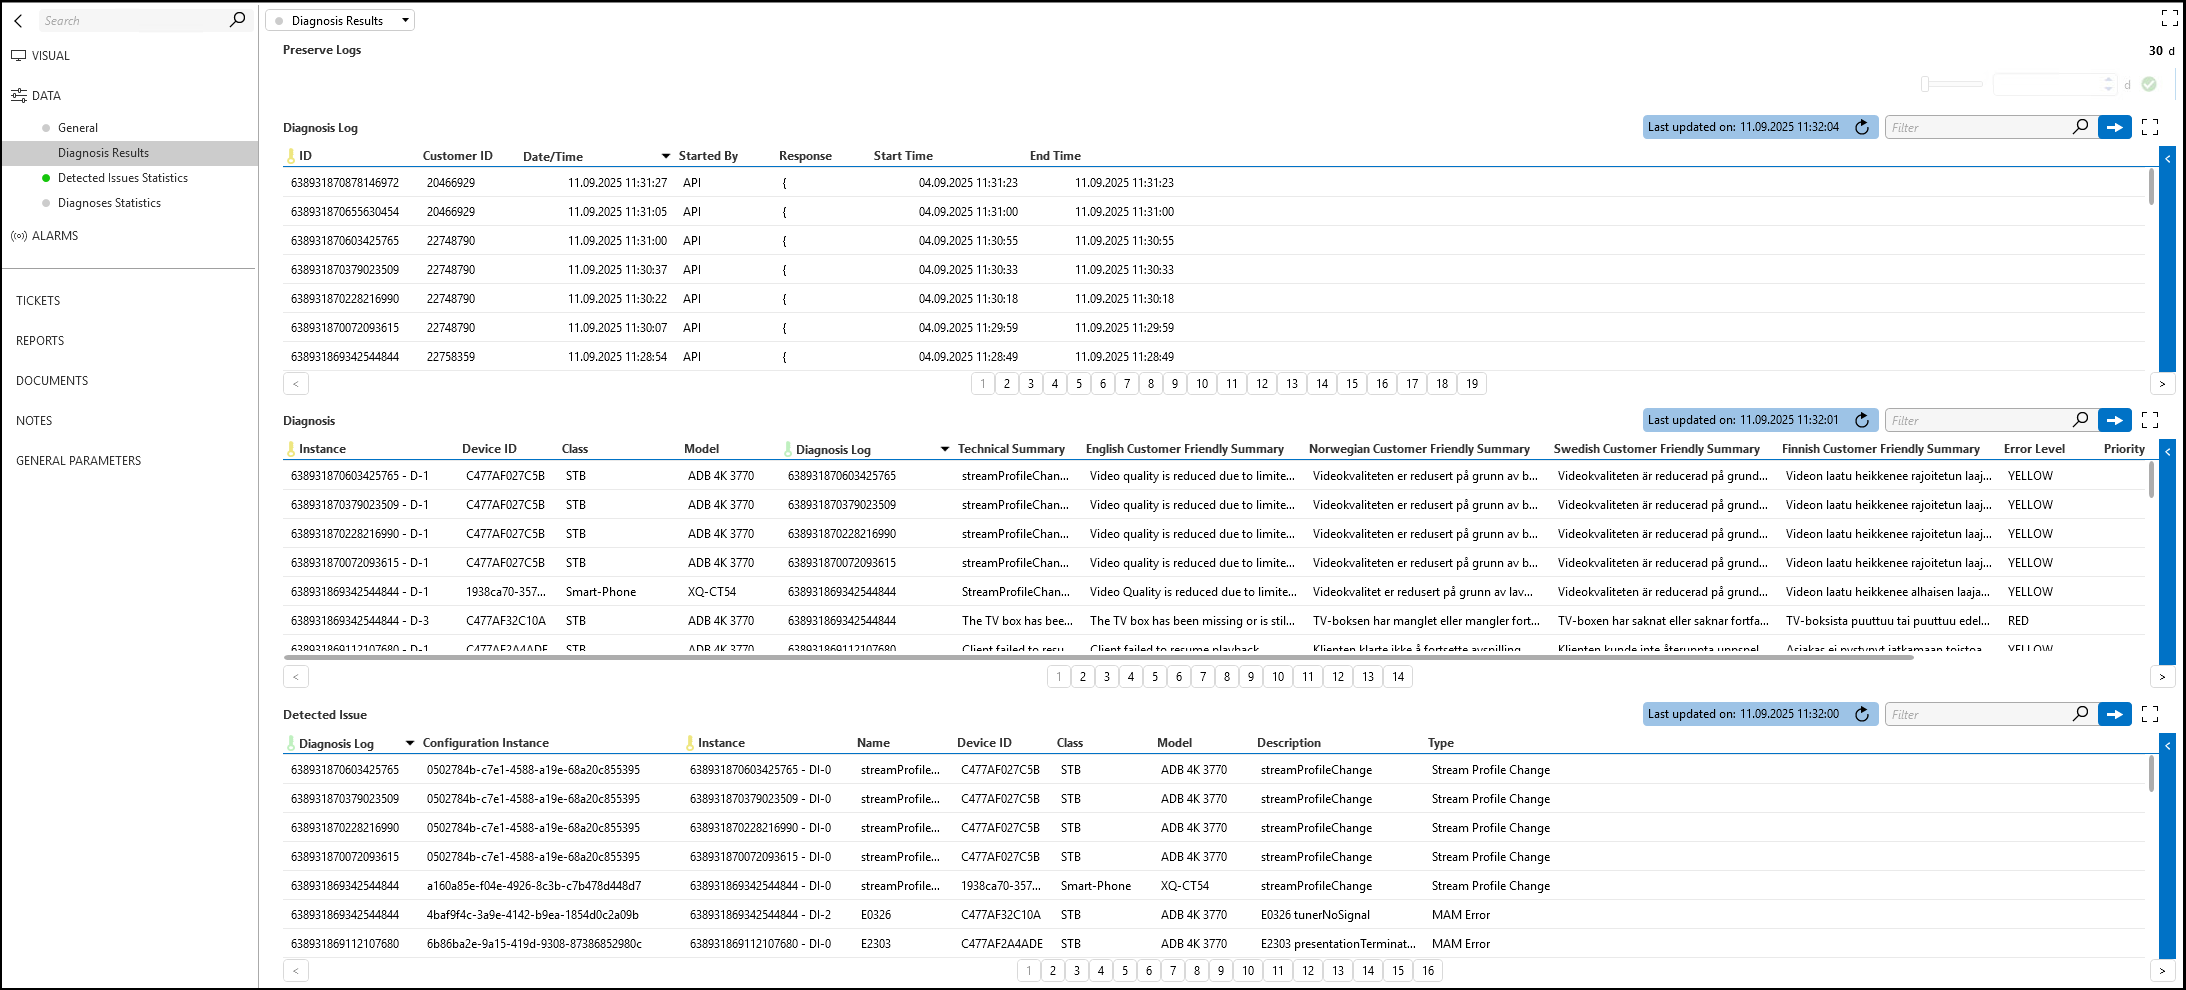
- Diagnosis Log: Information about the diagnosis process, including the diagnosis time, the start and end times, the customer ID, the user or process that started the diagnosis, and the JSON response containing diagnosis results.
- Diagnosis: Linked with the diagnosis configurations, this table contains the diagnoses generated when the run for a specific diagnosis configuration results in a diagnosis for the device.
- Detected Issue: Table containing all detected issues, linked with the specific diagnosis run.
Diagnoses and detected issues aggregation by device class type is performed every 5 minutes. Diagnosis results are stored in tables dedicated for each device class type, while detected issues are stored in a single table with a device class type column.
These tables support further analysis and reporting.
Configuration
Connections
Virtual Connection - Main
This connector uses a virtual connection and does not require any input during element creation.
How to Use
General
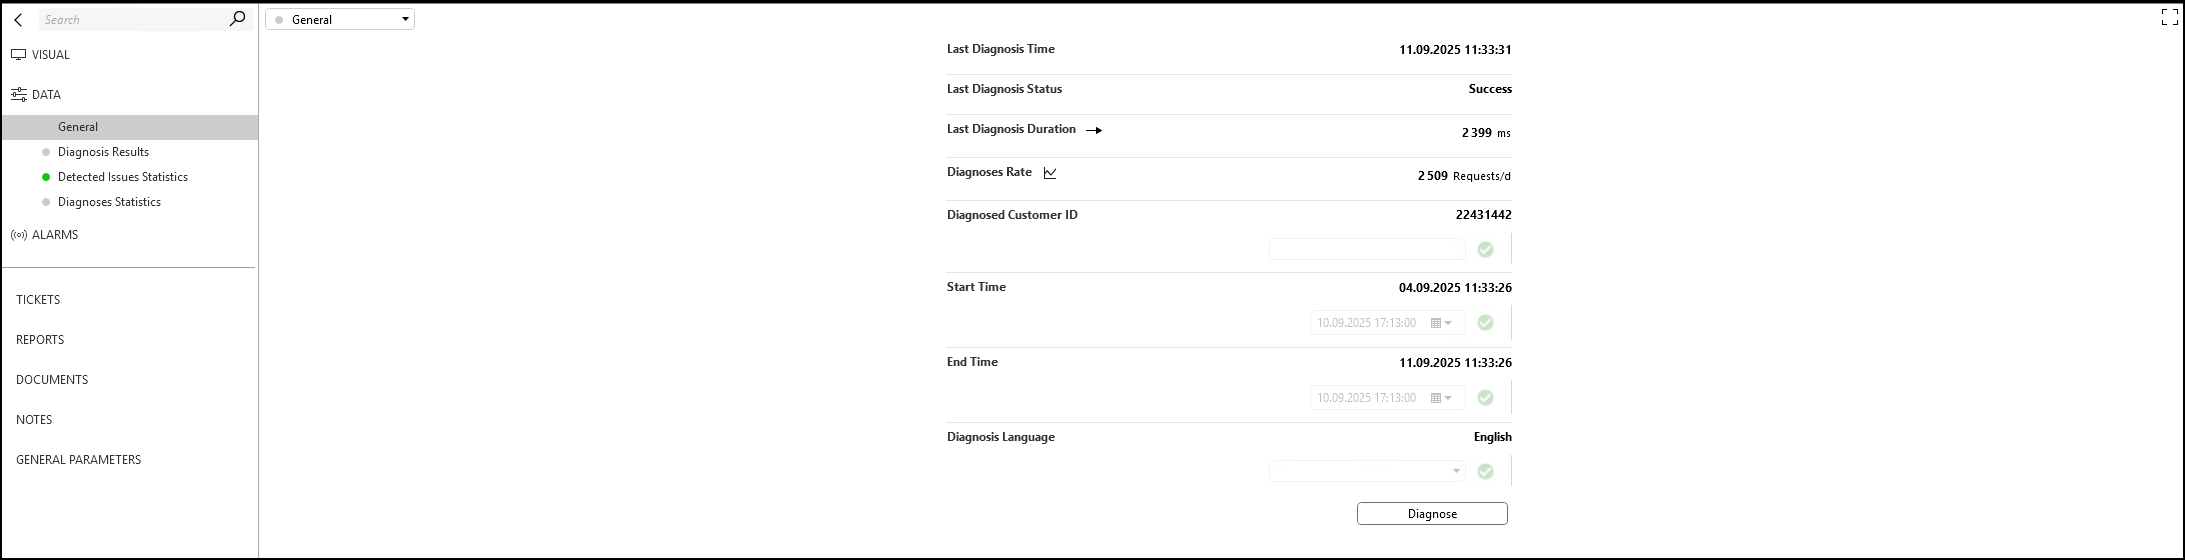
On the General page, you can:
- Configure input parameters (Diagnosed Customer ID, Start Time, End Time, and Diagnosis Language).
- View information about the last diagnosis run, including the time it was started, its duration, and the status of the last run.
Diagnosis Results
Diagnosis results are shown on a separate page, in the Diagnosis Log, Diagnosis, and Detected Issue tables.
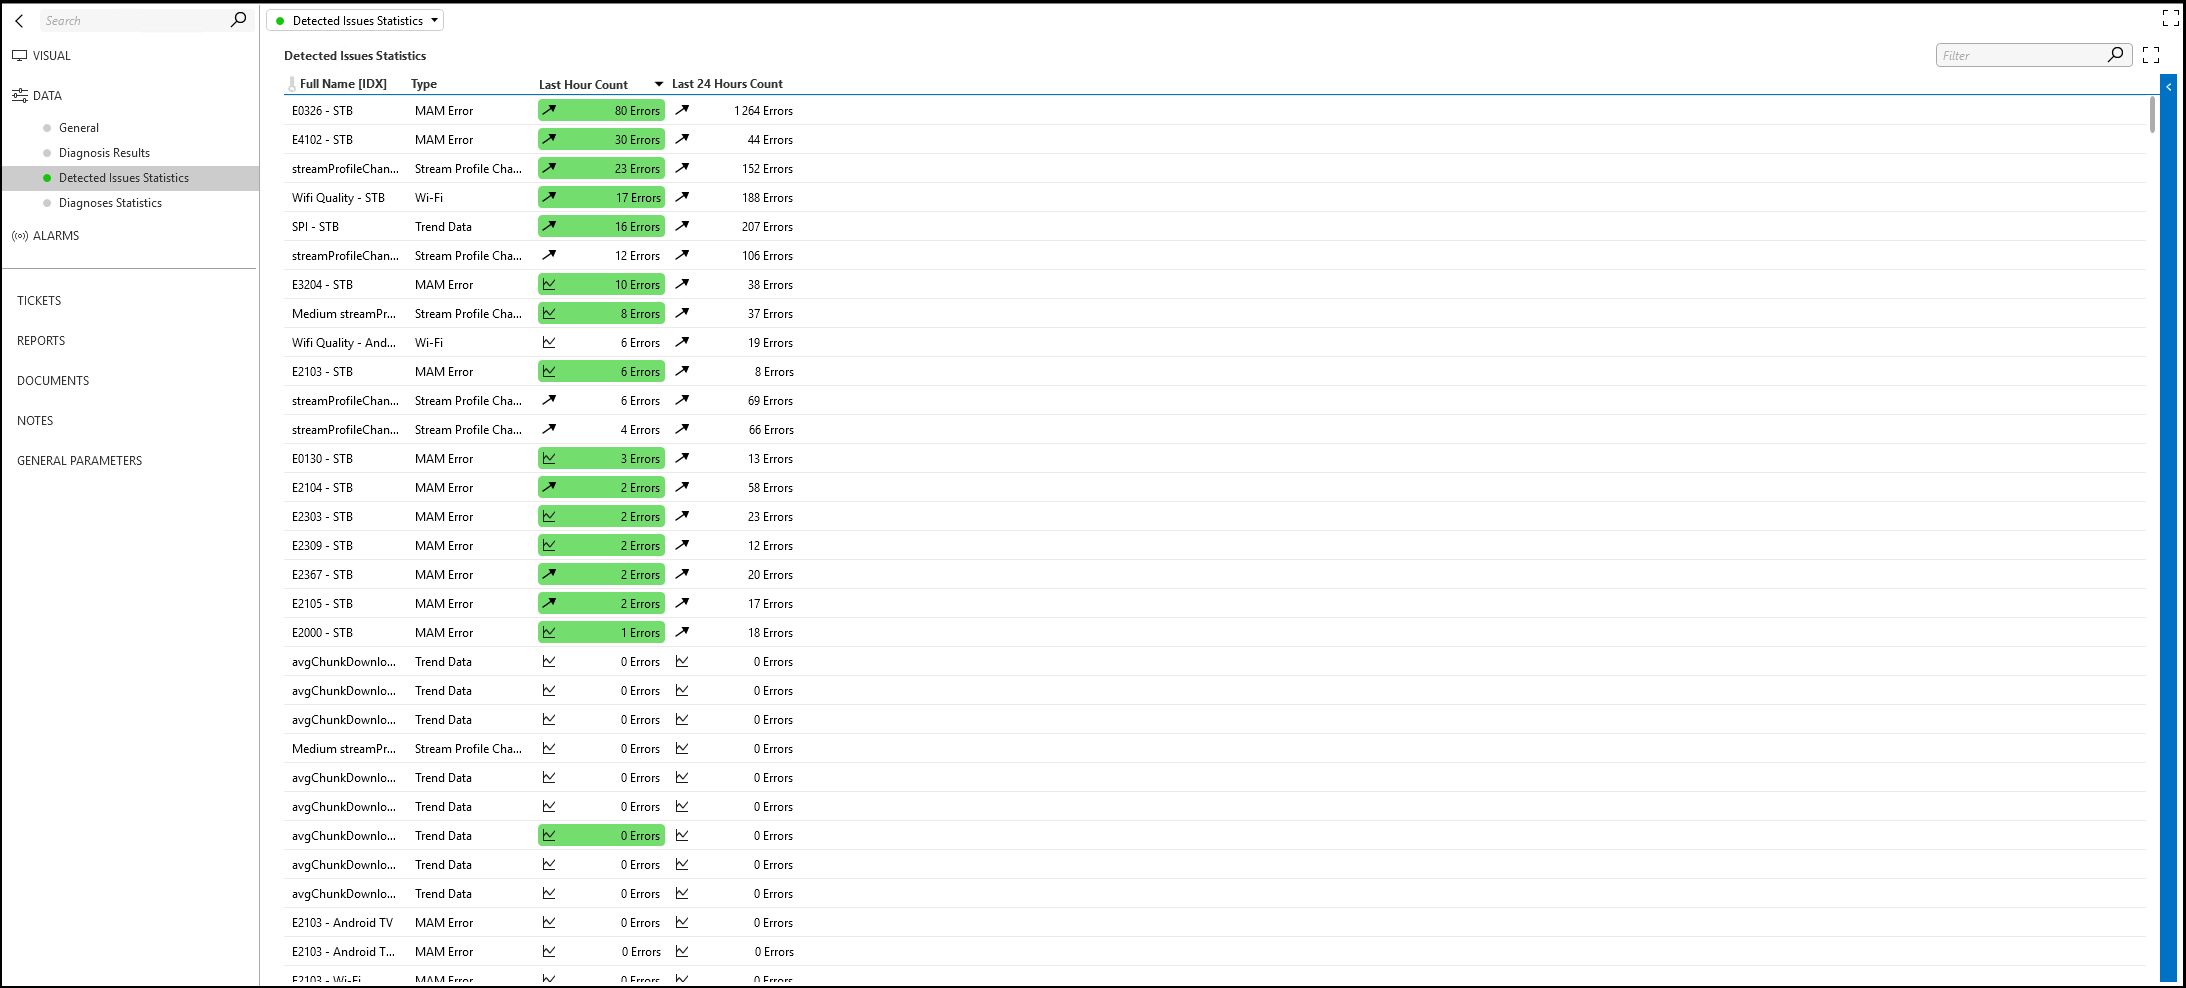
Detected Issues Statistics
In the detected issues statistics, you can find the error count for each configured detected issue in the last hour and the last day, aggregated by device class type (STB, Smartphone, Tablet, Chromecast, PC Portal, Apple TV, Android TV, Android TV Launcher):
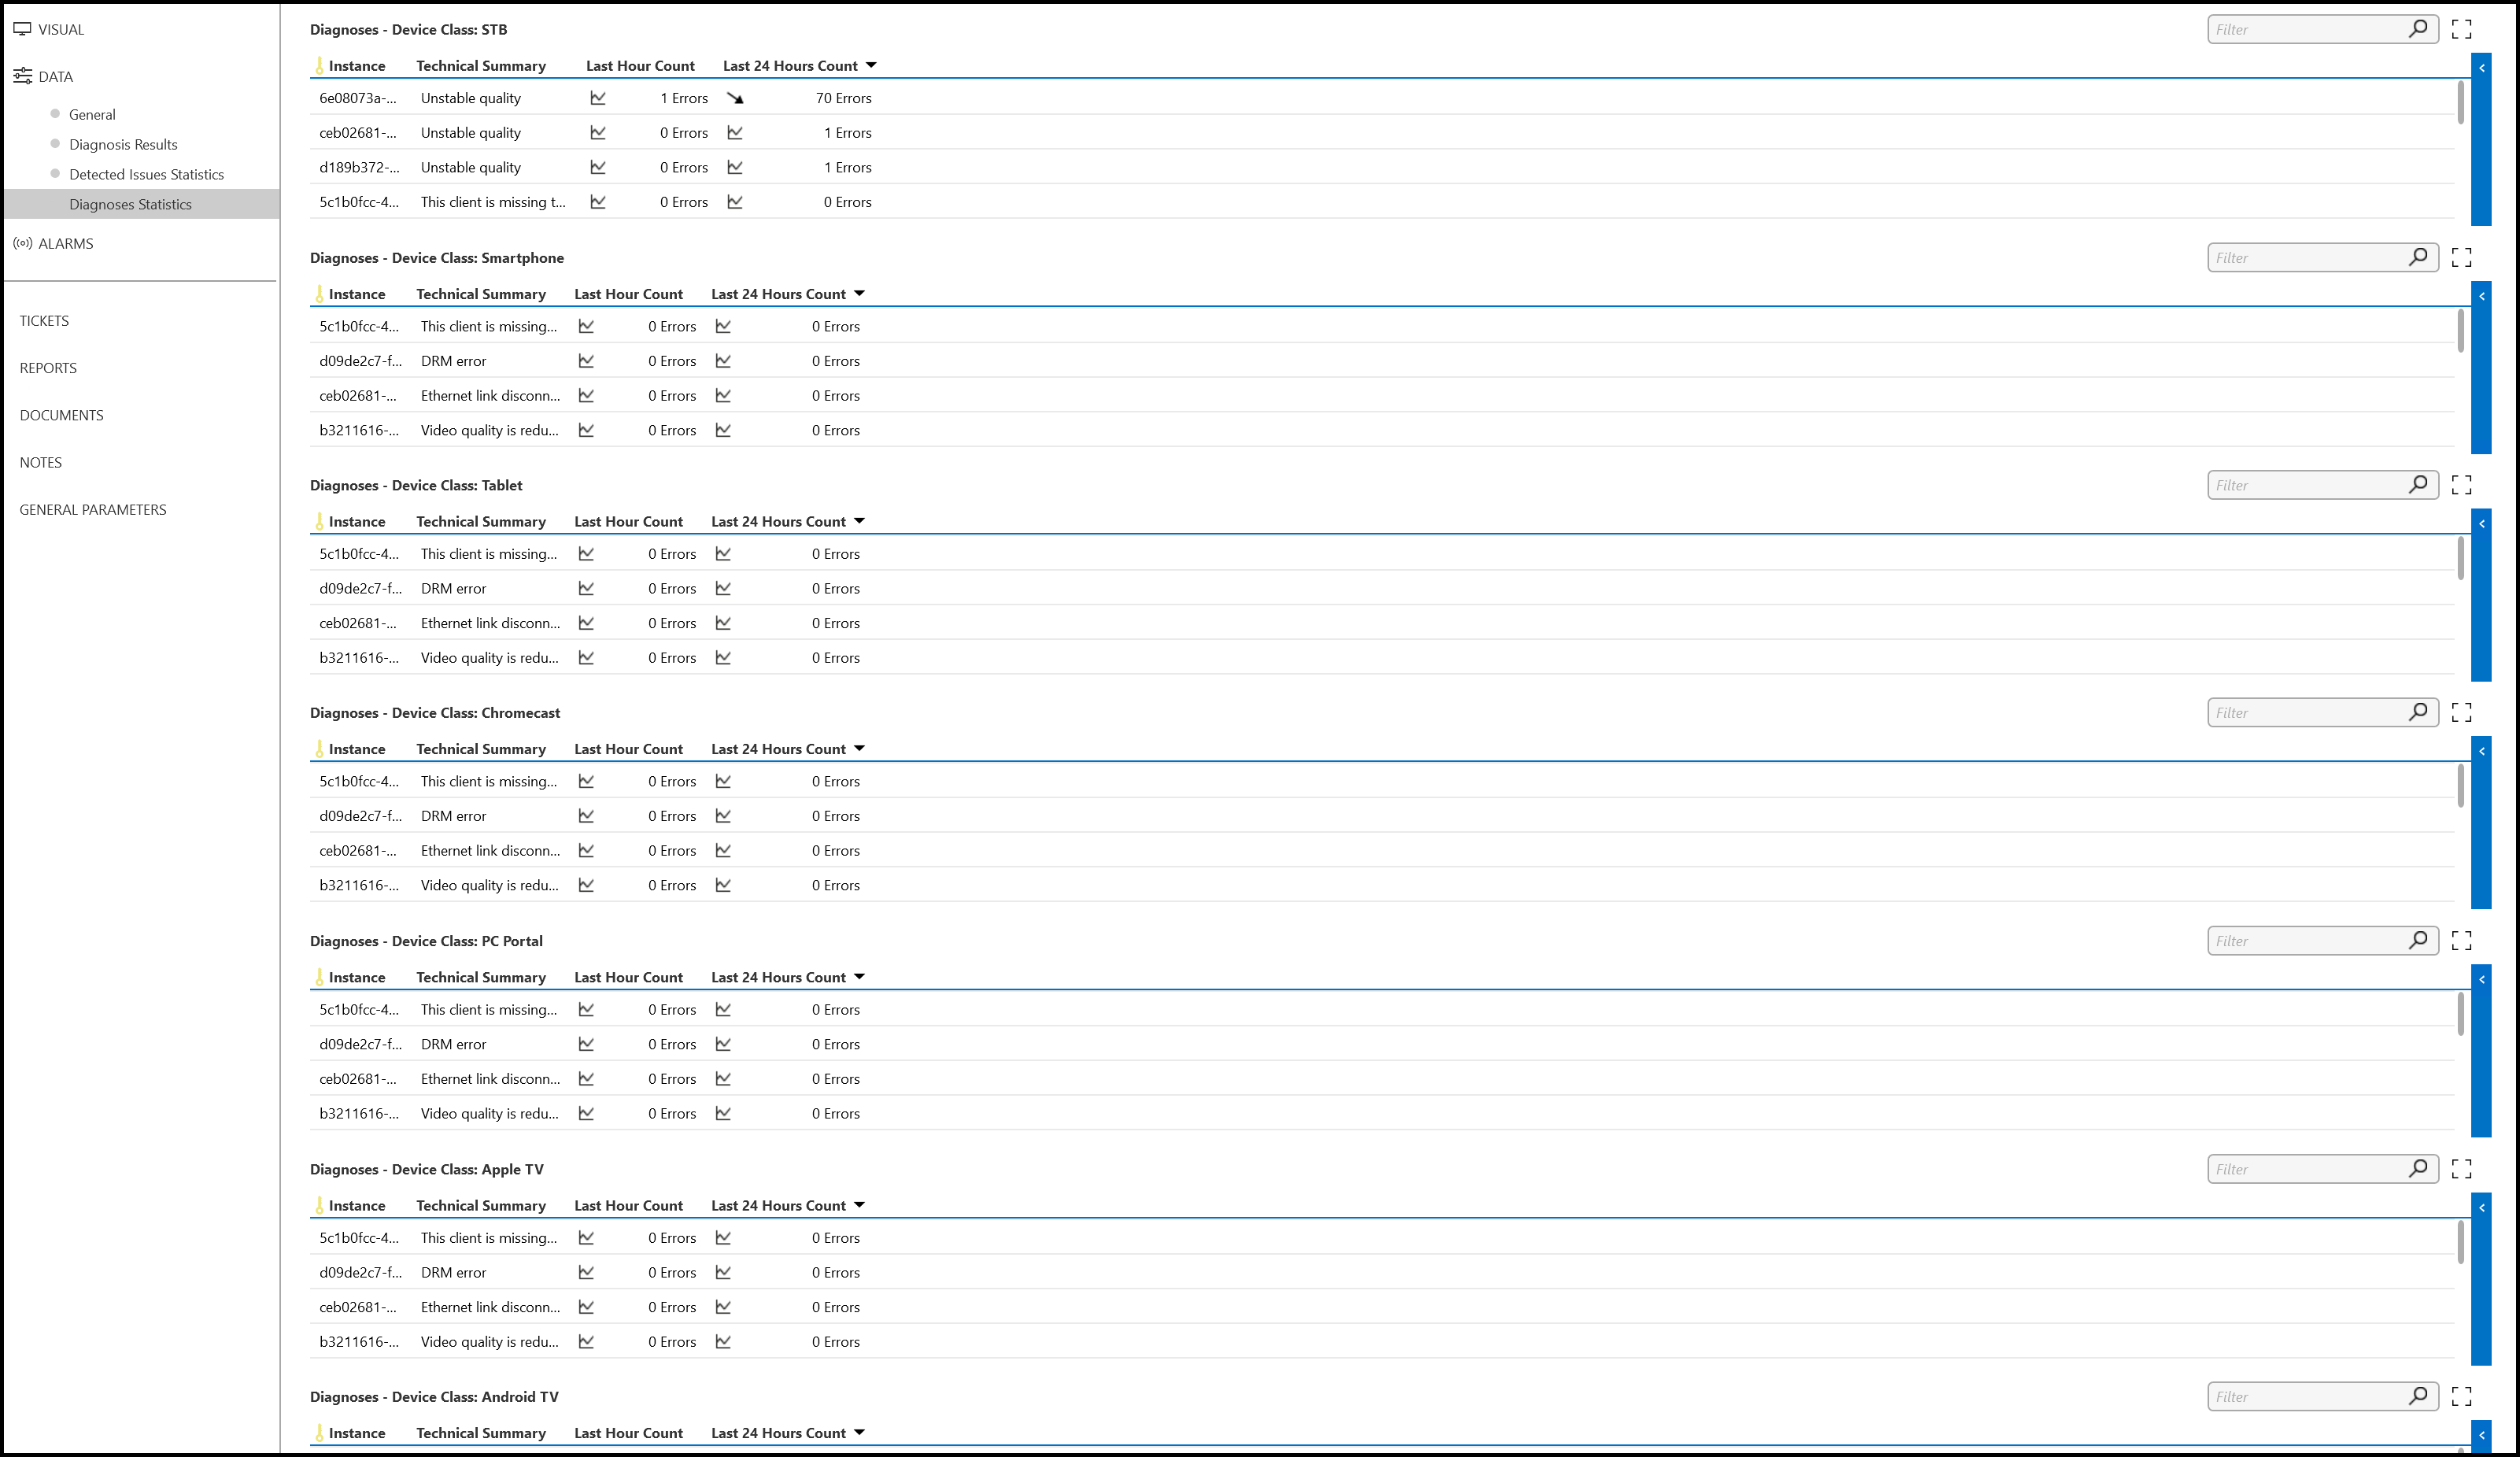
Diagnoses Statistics
In the diagnoses statistics, you can find the error count for each configured diagnosis in the last hour and the last day, aggregated by device class type (STB, Smartphone, Tablet, Chromecast, PC Portal, Apple TV, Android TV, Android TV Launcher):