Viewing the Failover setup
Note
To monitor the history of a Failover setup, you can use the Generic Failover Status connector. This allows you to activate monitoring and trending on the Failover state.
To view a graphical representation of how two DMAs are set up as each other’s backup:
In Cube, go to Apps > System Center > Agents.
In the lower-right corner of the manage tab, click the Failover button.
The screenshot below shows such a graphical representation with two teamed DMAs acting as one virtual DMA, with corporate IP address 10.10.83.61. In the screenshot, the second DMA in the team is online, while the first one is standing by.
Note that the active as well as the passive team member are connected to both the corporate and the acquisition network. Although they act as one single DMA, accessible to all other DMAs in the cluster via a pair of shared virtual IP addresses, each separate team member is also accessible via its own pair of fixed IP addresses.
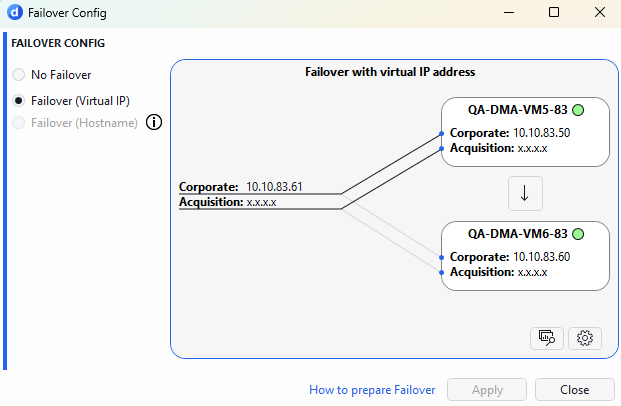
The Failover Config window in DataMiner 10.6.5
You can also use a shared hostname instead of two virtual IP addresses to represent the Failover pair. However, the active and passive DMA are still indicated in the same manner.