Viewing trend information in a histogram by drilling down on a parameter
Go to the trend information by drilling down on a parameter in a card. See Accessing trend information from a card.
Above the trend graph, click Histogram.
To specify further options, below the histogram, click Advanced:
Next to Start time and End time, specify a custom time interval to represent in the histogram.
If you do not want DataMiner to automatically determine the intervals, clear the Automatic intervals box and configure the settings below:
Next to Interval width, specify a custom interval width.
Next to Minimum value and Maximum value, specify a different range for the histogram.
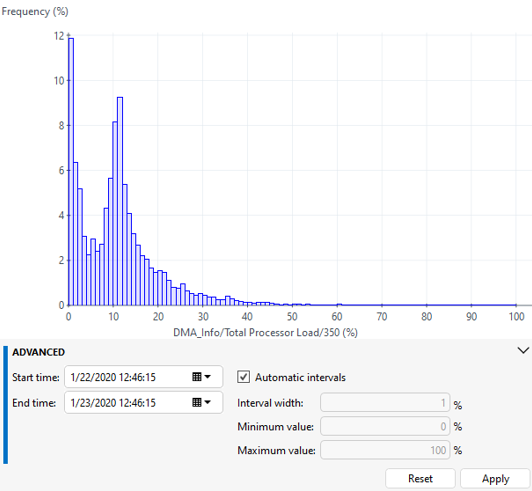
Histogram in DataMiner 10.4.5To change the displayed range of data, you can also:
Zoom in on a particular section, by dragging while keeping the left mouse button clicked, or by using the mouse scroll wheel.
Pan the graph along the X-axis, by dragging while keeping the right mouse button clicked.
Note
In the user settings, this default behavior can be modified, so that, for example, the left mouse button can be used to pan instead. See Trending settings.