Jenkins
Important
This section includes information that is only applicable to Skyline employees and/or links that are only accessible to Skyline employees.
The Jenkins build server (https://jenkins.skyline.be) will execute a pipeline run as soon as you perform a push to a Git repository hosted on Gerrit.
When you log in to Jenkins, you will see a folder structure that is organized as follows:
Protocols: This is the root folder that contains all the protocol-related pipelines.
Vendor: The Protocols folder contains multiple subfolders, one for each vendor.
DataSource: Each vendor folder contains multiple subfolders, one for each data source.
When you navigate to a data source, an overview of the different available branches is displayed:

Overview of the different branches of a data source in Jenkins
On the Tags tab, an overview of the existing tags is displayed:
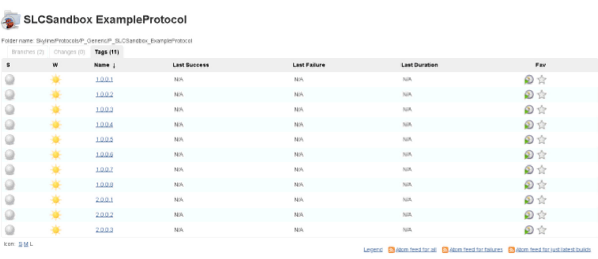
Overview of the different tags of a data source in Jenkins
The columns in this overview have the following meaning:
S: Status of the last build. The icon is green for a successful build, red for a failed build and gray if no build has been performed yet.
W: Aggregated status of recent builds shown as a weather report. If multiple builds have failed in sequence, this column displays a cloudy or even a rainy icon. If there are multiple successful builds in sequence, a sunny icon is displayed.
Name: Name of the branch or tag.
Last Success: Indicates how long ago the last successful build occurred.
Last Failure: Indicates how long ago the last failed build occurred.
Last Duration: Indicates the duration of the last build.
Fav: This column allows you to reschedule a build and to mark this as a favorite.
When you select a particular branch or tag, an overview of the most recent builds for this branch or tag is displayed:
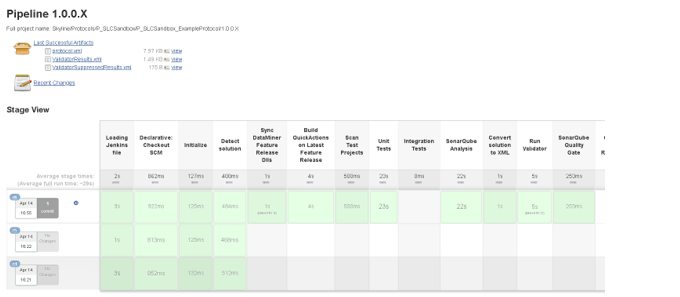
Branch overview in Jenkins
To get a more modern visual representation, you can click the Open Blue Ocean link in the menu on the left.
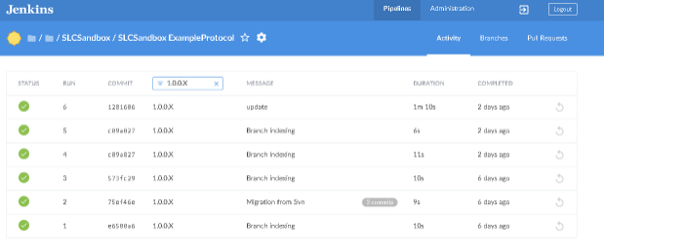
Branch overview in Jenkins
Here, you can click a specific row to get more information about that build.
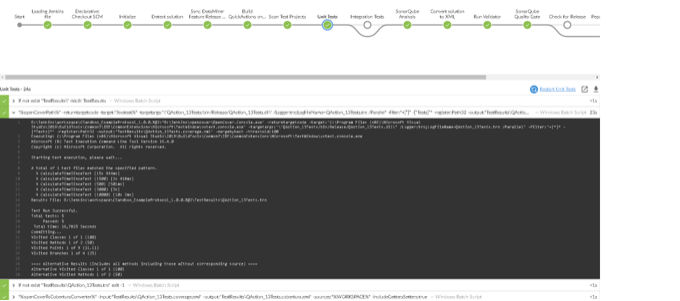
Build information in Jenkins
This will include a graphical overview of all the steps that have been executed in this pipeline.
In case a step succeeds, the icon for that step will be green. In case a step fails, the icon for that step will either be yellow (indicating "unstable") or red (indicating "error"). When a certain step has been skipped, a gray icon will be displayed for that step and the line will go around the step.
In case you want to see more information about a specific step, you can click the step icon and then below the pipeline you will see collapsed items representing the pipeline. Click on the header of an item to expand it and see the output for that item. Figure 8 shows the output for the Unit Tests step.
The pipeline also generates the following artifacts upon successful completion:
Pipeline log
Protocol.xml
ValidatorResults.xml
ValidatorSuppressedResults.xml
MajorChangeCheckerResults.xml (if applicable)
MajorChangeCheckerSuppressedResults.xml (if applicable)
You can find these by clicking the artifacts button in the top menu for a specific run.

Artifacts in Jenkins
In the Jenkins classic web UI, you can inspect the reported MSBuild errors, DIS Validator issues and Major Change Checker issues, if any.
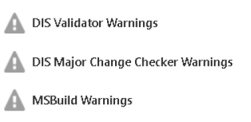
Warnings displayed in Jenkins
Clicking on the DIS Validator Warnings link, for example, will bring you to a page providing an overview of the detected issues.
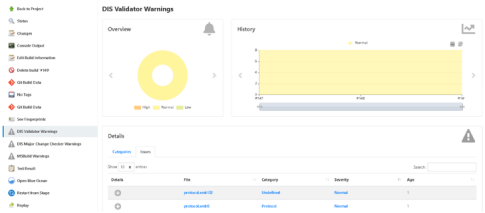
Overview of detected issues in Jenkins
Under Details, you can click a specific issue to view more information related to this issue:
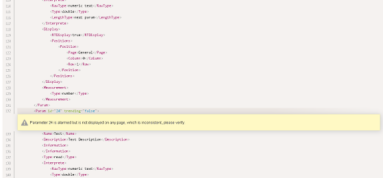
Detailed information on issue in Jenkins
Note
In case there are too many reported issues, the publishing step will be skipped. To inspect the results in such a case, consult the XML artifacts.
- In case the DIS Validator reports over 200 issues, the validator results will not be published to the Jenkins Warnings plugin.
- In case the DIS Major Change checker reports over 50 major changes, the validator results will not be published to the Jenkins Warnings plugin.
- In case publishing takes too much time, the results will not be published to the Jenkins Warnings plugin (the timeout has been set to 30s for MSBuild results and 1 minute for DIS Validator and DIS Major Change Checker results).