Concept of debugging QActions and automation scripts
DataMiner Integration Studio allows you to debug connector QActions and automation script C# Exe blocks using the Microsoft Visual Studio Debugger.
Note
You can only debug connector QActions that contain C# code.
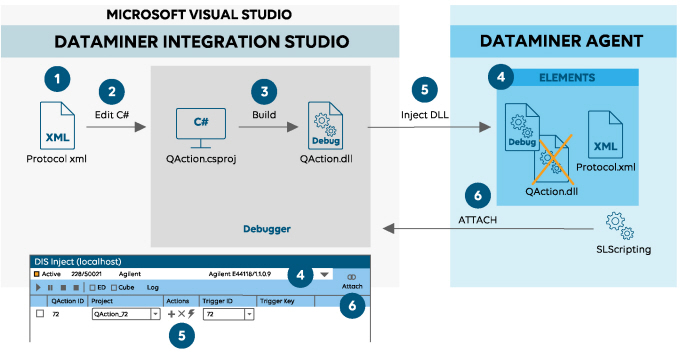
Graphical representation of the QAction debugging concept
Below, you can find a graphical representation of the way QActions are debugged. Automation scripts are debugged in a similar way.
The numbers in the drawing refer to the phases described in the table below.

The QAction debugging process
Phase |
Description |
|---|---|
| 1. Open the protocol XML file | You open the protocol XML file, which can be stored locally or on a DMA. |
| 2. Edit the QAction | In the protocol XML file, you locate the QAction, and click the Edit C# button in front of the QAction tag. Result: A temporary C# project will be created. |
| 3. Build the QAction project | You build the temporary C# project. No errors should occur. |
| 4. Select an element | In the DIS Inject tool window, you select an element that uses the protocol you are currently debugging. Result: All QActions in the protocol of that element are listed in the DIS Inject window. |
| 5. Inject the QAction.dll | In the DIS Inject tool window, you link the temporary QAction project to the corresponding QAction of the element, and you replace the QAction.dll of the element (which has been compiled in Release mode) with the QAction.dll of the temporary QAction project (which has been compiled in Debug mode). |
| 6. Attach Debugger to SLScripting | In the DIS Inject tool window, you click Attach to attach the Microsoft Visual Studio Debugger to the DataMiner SLScripting process. Result: From the moment the Debugger is attached to the SLScripting process, you can set breakpoints, trigger the QAction manually (or set a parameter or wait for a timer to go off), step through your code, etc. |
For step-by-step instructions on how to debug QActions and automation scripts, see Debugging connectors and automation scripts.