DIS Diagram
If you click Tool Windows > DIS Diagram, the DIS Protocol Diagram window will appear.
This window shows a graphical representation of a protocol. It allows you to see how a protocol is built, navigate through its logic, and investigate flow issues.
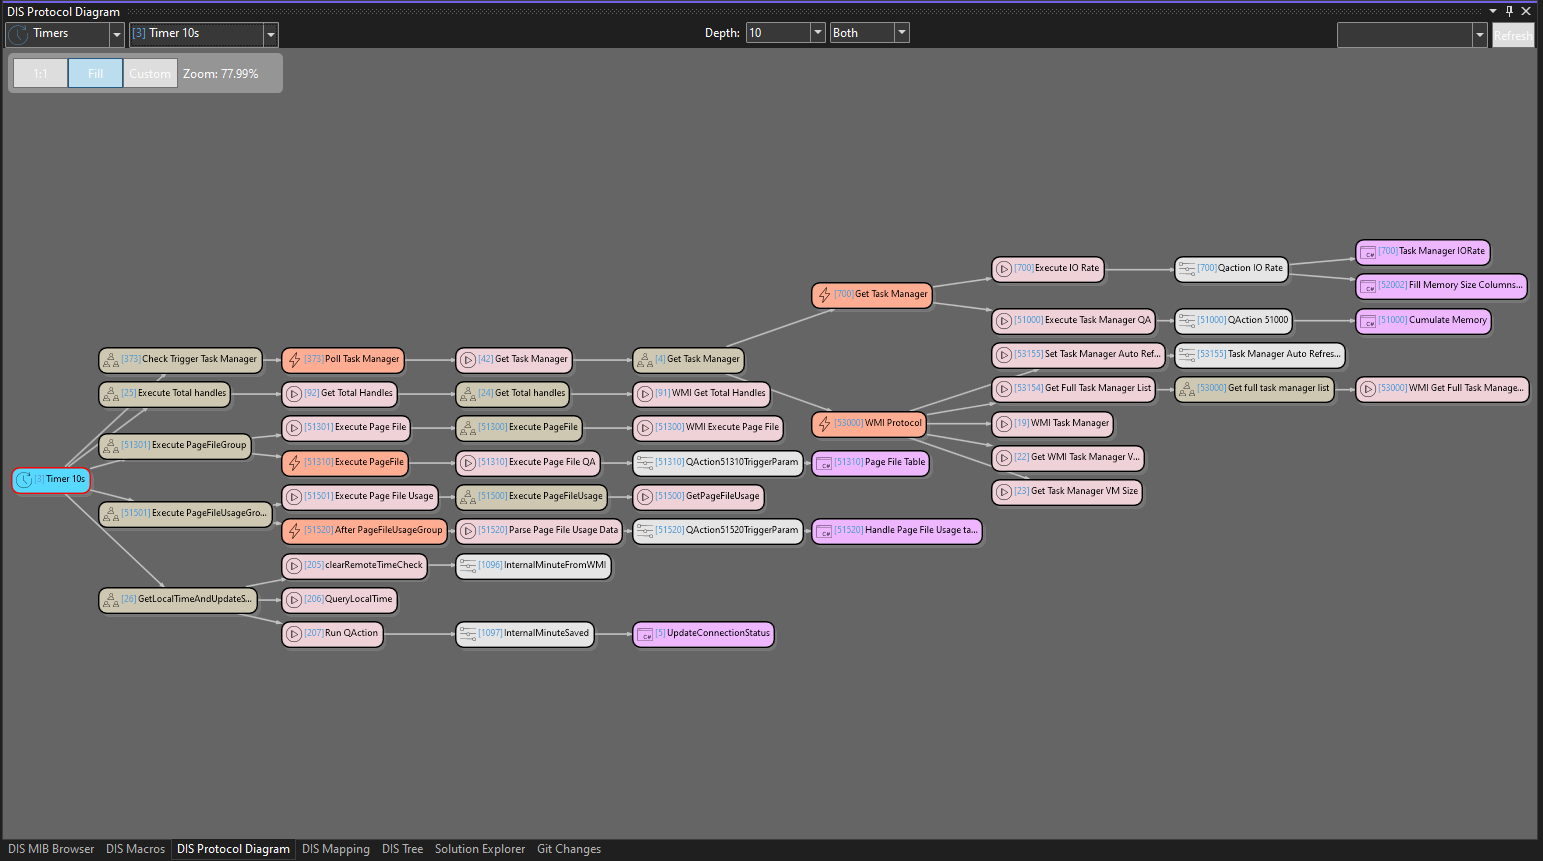
When you open the tool window, you first have to select an item to start from: a parameter, a QAction, a session, a response, a group, a trigger, an action, or a timer. You can then set the required depth (i.e., the number of items you want to have displayed starting from or ending with the item you selected), the direction (see the table below), and the type of diagram (BoundedFR, EfficientSugiyama, FR, ISOM, KK, LinLog, LeftRightTree, or TopBottomTree).
| Direction | Description |
|---|---|
| Forward | Shows the specified* number of linked items starting from the item you selected. |
| Reverse | Shows the specified* number of linked items ending with the item you selected. |
| Both | Shows the specified* number of linked items starting from the item you selected, as well as the specified* number of linked items ending with the item you selected. |
* The value entered in the Depth box.
In the diagram itself, each item (parameter, QAction, session, response, group, trigger, action, timer) is represented by a box with a particular icon and color, showing the ID and name of the item.
Click the ID of an item to navigate to that item in the protocol.xml file.
Hover over an item to see a tooltip with its full name and full description.
Double-click a box representing an item to make that item the new starting point of the diagram. This will cause the entire diagram to be redrawn.
In the upper-left corner of the diagram, you also have a number of zoom options: a slider to adjust to zoom factor, a 1:1 button (to switch to zoom factor 1) and a Fill button to automatically adjust the zoom factor to the current size of the diagram window.