DIS Inject
If you click Tool Windows > DIS Inject, the DIS Inject window will appear.
By default, the DIS Inject window will open undocked. Dock it just as you would dock any other tool window in Visual Studio.
This tool window allows you to make the necessary preparations before debugging the connector QAction(s) or automation script C# Exe block(s) you are editing.
For step-by-step instructions on how to debug connector QActions and automation script C# Exe blocks, see Debugging connectors and automation scripts.
Connecting to one of the Agents specified in the DIS settings
When you open the DIS Inject window, and you have not yet set up a connection to one of the DMAs specified in the DMA tab of the DIS Settings window, a large Connect button will appear in the middle of the window. Click that button to connect DataMiner Integration Studio to the default Agent. If you want to connect to another, non-default Agent, click the dropdown button at the right of the Connect button, and click the Agent to which you want to connect.
Note
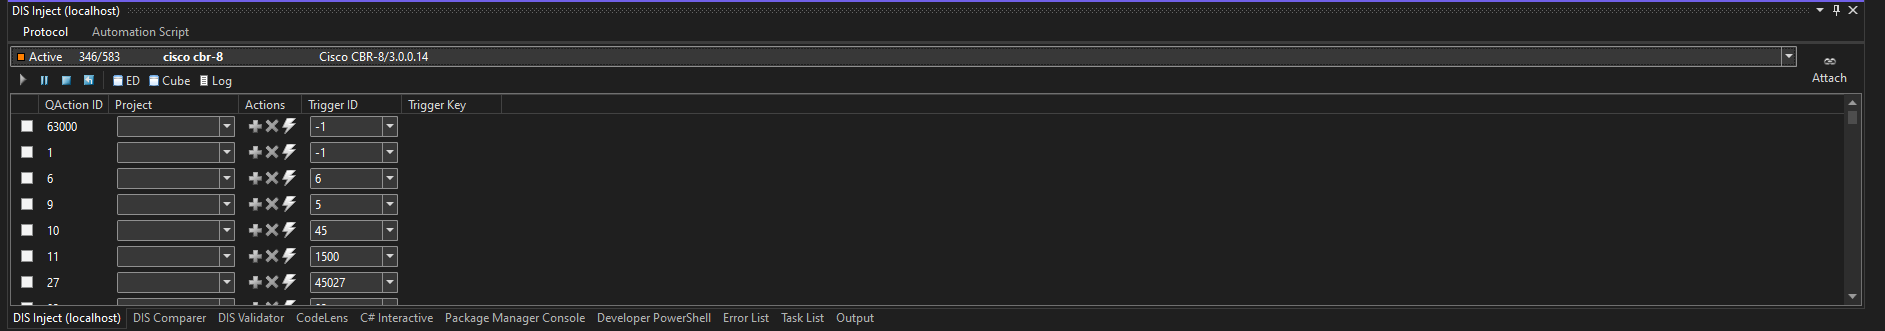
The title of the DIS Inject window includes the name of the Agent to which DIS is connected (between brackets). When DIS is not connected to any Agent, the window title will include "(not connected)".
Debugging a connector QAction
Go to the Protocol tab if you want to debug a connector QAction.
Selecting an element from the connected DMA
Use the selection box at the top of the window to select the element to be used during the debugging operation. This must be an element that uses the exact same protocol as the one you are currently editing.
Manipulating the selected element
Below the element selection box you can find the element manipulation tool bar. From left to right, the buttons on this toolbar allow you to:
Start the element
Pause the element
Stop the element
Restart the element
Open the element in Element Display (no longer used)
Open the element in DataMiner Cube
Open the element’s log file.
Note
If DIS is connected to a remote DataMiner Agent, then make sure the
C:\Skyline DataMiner\loggingfolder on that DataMiner Agent is shared and accessible.
Linking temporary QAction projects to QActions in the protocol of the selected element
When you have selected an element in the element selection box, the DIS Inject window will list all QActions found in the protocol of the selected element, and will automatically link the temporary projects of the QActions that are being edited to the QActions in the list based on protocol name and QAction ID.
When, for example, you open a QAction with ID 12, then the temporary project will be named "QAction_12". By default, when you open the DIS Inject window while editing QAction 12, then the Project selection box in row 12 will be set to "QAction_12". If you want to override this default linking mechanism, and you want to link a different temporary project to a particular QAction, open the Project selection box, and select another project.
| If you click... | then... |
|---|---|
| the green plus, | you will replace (i.e., inject) the element's QAction.dll file (compiled in Release mode) with its counterpart found in the temporary QAction project (compiled in Debug mode). |
| the red X, | you will sever the temporary link between the element and the QAction.dll compiled in Debug mode. This will restore the link between the element and its original QAction.dll (compiled in Release mode). |
| the yellow lightning bolt, | you will manually trigger the QAction by simulating a change of the parameter selected in the Trigger ID box (in case of a dynamic table parameter, use the Trigger Key box to specify the table row). Only do this after you have attached the SLScripting process(es) to the Debugger. |
Attaching the Microsoft Visual Studio Debugger to the DataMiner SLScripting process(es)
After injecting the necessary QAction.dll files, you have to attach the Debugger to the SLScripting process(es).
| If you click... | then... |
|---|---|
| Attach | all temporary QAction projects will be built, and the Microsoft Visual Studio Debugger will be attached to the DataMiner SLScripting process(es). Note: The design of the Microsoft Visual Studio screen will change and you will notice the word "Running" in the title bar. |
| Detach | the Microsoft Visual Studio Debugger will be detached from the DataMiner SLScripting process(es). |
Debugging an automation script
Go to the Automation script tab if you want to debug an automation script.
Selecting an automation script from the connected DMA
Use the selection box at the top of the tab to select the automation script to be debugged.
Linking Exe block projects, assigning values to script parameters, and linking elements to script dummies
- In the Exe blocks list, go to the row of which the Exe ID matches that of the Exe block you have opened. If necessary, in the Project column, select another temporary Exe block project.
- In the script parameters list, assign a value to each of the script parameters in the list.
- In the script dummies list, link a DataMiner element to each of the script dummies in the list.
Attaching the Microsoft Visual Studio Debugger to the DataMiner SLAutomation process
After linking the Exe block projects, assigning values to the script parameters, and linking elements to the script dummies, you have to attach the Debugger to the SLAutomation process.
| If you click... | then... |
|---|---|
| Attach | all temporary Exe block projects will be built, and the Microsoft Visual Studio Debugger will be attached to the DataMiner SLAutomation process. Note: The design of the Microsoft Visual Studio screen will change and you will notice the word "Running" in the title bar. |
| Detach | the Microsoft Visual Studio Debugger will be detached from the DataMiner SLAutomation process. |
Triggering the automation script
Click Execute to manually trigger the automation script.