Wireshark
Wireshark is a protocol analyzer.
You can download Wireshark from the Wireshark website.
Tip
For more information, see the Wireshark User's Guide.
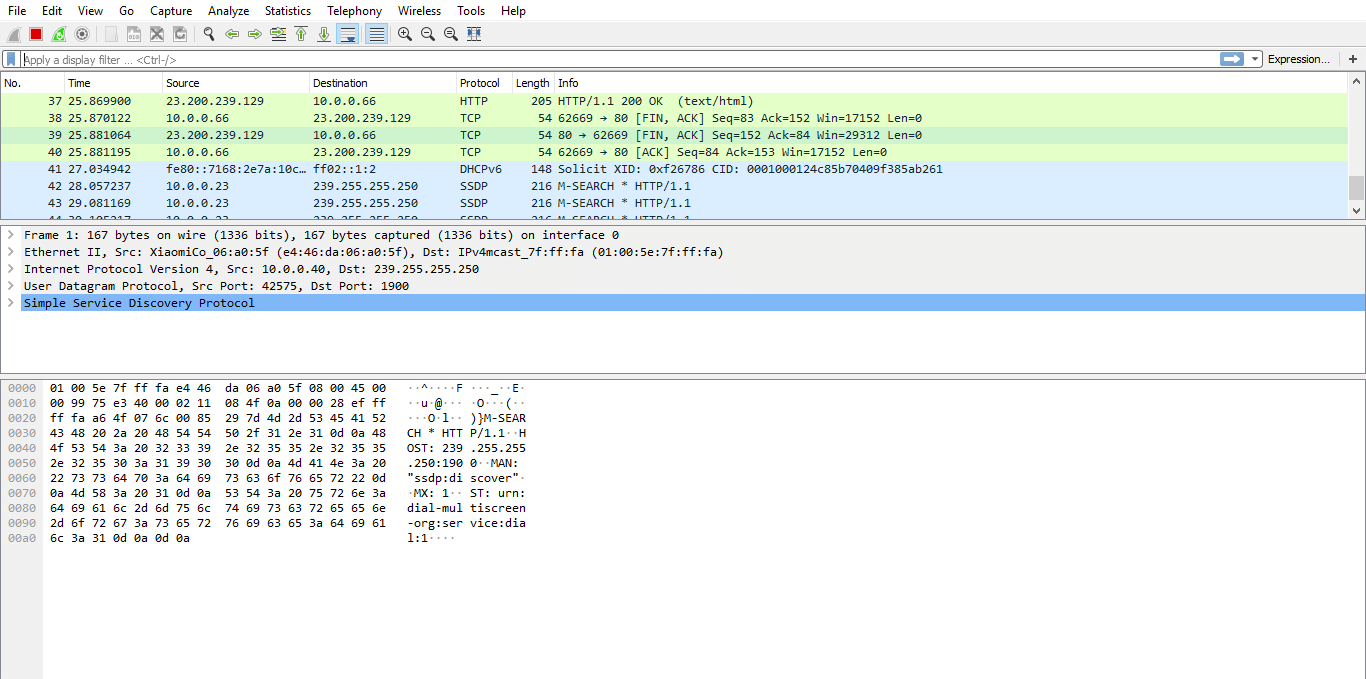
Wireshark UI
Capturing traffic
To capture packets:
Go to Capture > Options
Select the interface and specify a capture filter to limit the number of captured packets.
Always try to provide a packet filter so only the required packets are captured. For example, the following capture filters can be used:
tcp port http: Only capture HTTP traffic to or from TCP port 80.
port 161: Only capture SNMP traffic to or from port 161 (both TCP and UDP).
host 10.5.1.7: Only capture traffic to or from host 10.5.1.7.
net 10.213.5.0/24: Only capture traffic to or from network 10.213.5.0 (hosts 10.213.5.0 – 10.213.5.255).
host 10.5.1.7 and port 161: Only capture traffic to or from host 10.5.1.7 and port 161.
icmp: Only capture control traffic like ping requests/responses.
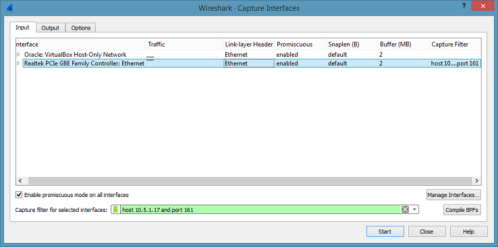
Wireshark Capture Interfaces input window
To stop capturing, click the Stop button.
Capturing traffic for a DataMiner element
Some extra steps can make it easier to capture traffic for a DataMiner element:
Check on which DMA the element is hosted.
Install Wireshark on the DMA if possible.
Alternatives like Microsoft Network Monitor and Microsoft Message Analyzer might already be available on the system. Their captures can also be opened by Wireshark. However, both these tools have been deprecated.
Check the IP or the port of the device that is getting polled by the element. Use these to define an adequate capture filter.
Select the correct input interface. You can find the IP of an interface by expanding it in Wireshark.
If the IP used by the element has no immediate link with the available interfaces, the interface that is used to route the traffic can be found using the following command in Powershell:
Test-NetConnection –ComputerName <ip/hostname> –DiagnoseRouting | Select-Object -Property RemoteAddress,SelectedSourceAddress. The interface IP used for routing is shown as SelectedSourceAddress.
Useful tips
Make Wireshark recognize incoming SNMP data
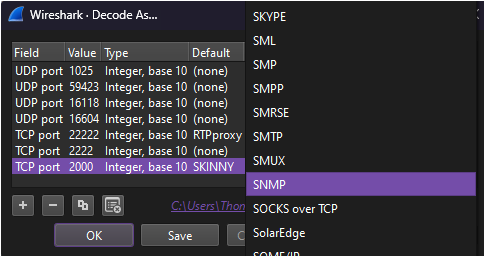
If a device uses a custom port to send packets of SNMP data, do the following to make Wireshark recognize that data as SNMP:
Right-click a packet.
Select Decode As.
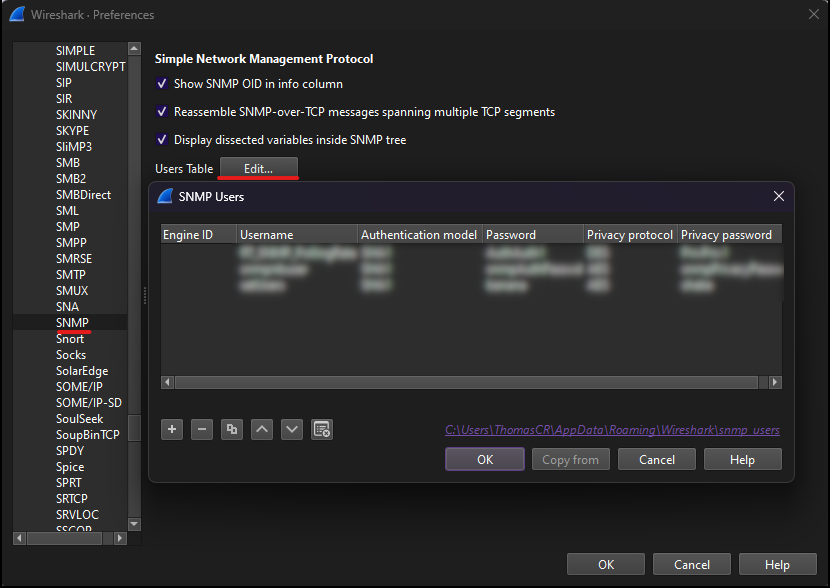
Configuring SNMPv3 user credentials in Wireshark preferences
To make sure that SNMPv3 packets get decrypted, configure the necessary user credentials in the Wireshark preferences.
Filtering serials packets
In case of a serial connector, you can use filtering to look for packets of which the payload contains a specific value. See the following example:
data.data[0:2] == 7b40
data.data[0:2]extracts the first two bytes from the data payload (starting from byte 0, with a length of 2).== 7b40compares the two above-mentioned bytes to the hexadecimal value 7b40.
Using 'I/O Graphs' to get an overview of traffic rates
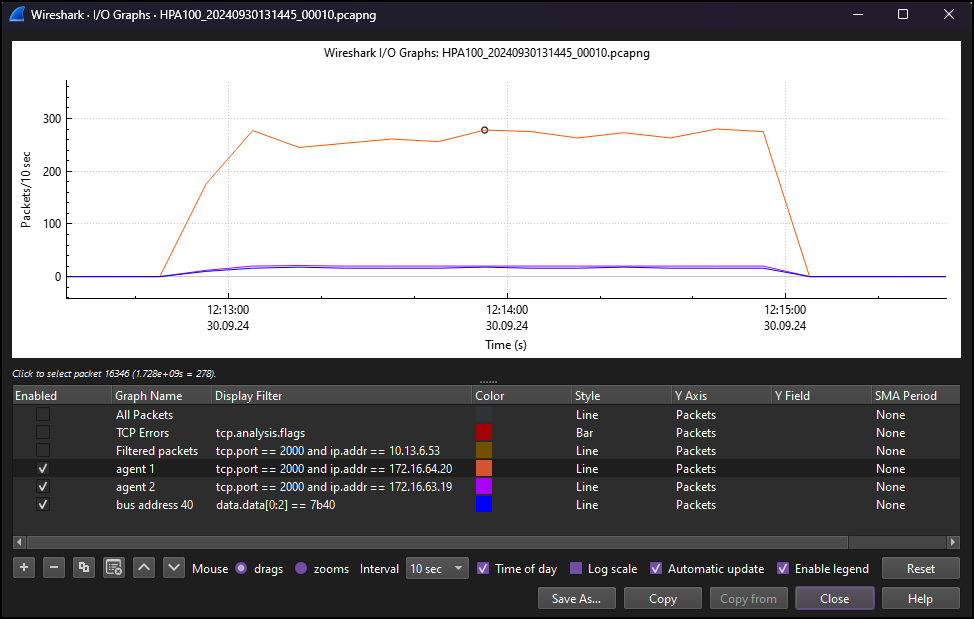
To get an overview of traffic rates, go to Statistics > I/O Graphs.
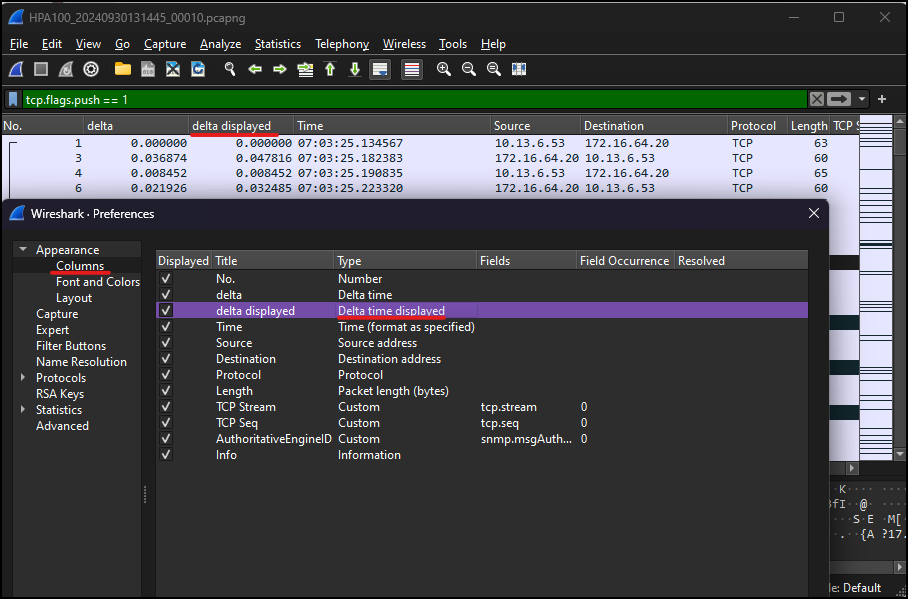
The 'delta displayed' column can reveal the response time between DataMiner and the device
The delta displayed column shows the time between displayed packets. Adding this column can reveal the response time between DataMiner and the device.
Notes on using Wireshark
Avoid leaving a capture running for too long
It is essential not to leave a Wireshark capture running for too long (e.g., double-check when you close a remote desktop session), as this can use up all memory.
To prevent situations where a Wireshark capture keeps running for too long, you can configure the following setting in the Output tab (Capture > Options):
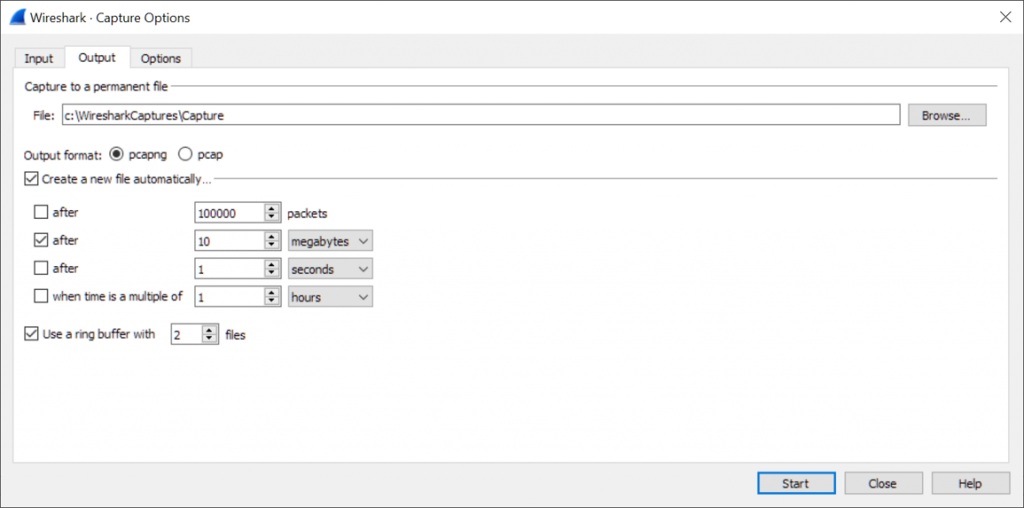
Wireshark Capture Interfaces output window
As a result, a new capture file will be created when 10 MB of traffic has been captured, and only the last two files will be stored.
Applying a display filter
In case a capture contains packets that are of no interest, you can apply a display filter. A display filter allows a more fine-grained selection of the captured data, for example based on the data inside the packet, or the HTTP URL that was requested, an SNMP OID that gets polled, the type of SNMP request or the time or number of an Ethernet frame.
Some examples:
http.request.method == “POST” && http.request.uri contains “XmlSchedRemoteCommand”: Display HTTP POST requests that contain XmlSchedRemoteCommand in their path.frame contains “<Field”: Display frames that contain the text<FIeld.snmp.name contains 1.3.6.1.4.1.3930.51.7: Display SNMP requests about OIDs containing 1.3.6.1.4.1.3930.51.7.data == 3: Display SNMP set requests.
You can then export the filtered packets (File > Export Specified/Packets) to get a new capture file that only contains the filtered packets.
Note
- To be able to filter frames based on a specific field in the network protocol, they need to be decoded correctly. If the traffic was sent to a port that is not well known (e.g., a port different from the 80/tcp for HTTP traffic), that might not be the case. However, Wireshark allows you to change the type. To do so, right-click the frame that matches the traffic and select Decode As. The dialog box allows you to tweak how the stream should get decoded based on a particular field value, like the destination port.
- In case you are only interested in the packets of a particular TCP stream, you can make use of Wireshark’s ability to follow a TCP stream. Select a TCP packet in the packet list of the stream/connection you are interested in and then select Follow > TCP Stream from the Wireshark Tools menu (or use the context menu in the packet list). Wireshark will then set a display filter and pop up a dialog box with all the data from the TCP stream laid out in order.
Tip
For more information, see Building Display Filter Expressions.
About the captured information
Wireshark will capture what is actually available on the wire. This means only traffic for the IP(s) on the selected network card (NIC) will be available for capture, next to broadcast and selected multicast traffic that is available on that network.
Exceptions to this can apply in the following situations:
When the NIC is connected to a virtual switch (e.g., in ESXi or Hyper-V), it could be set up to accept promiscuous mode requests. This is not recommended in a production environment.
When you are not connected to a switch (e.g., a hub) or when the switch is suffering from MAC address flooding. However, this should not occur in a healthy network.