How to aggregate alarm severities
Below, you can learn how to implement the aggregation of alarm severities from other DataMiner elements into a managing DataMiner element. To do this, the alarm level link feature is used.
For more information on this feature, see AlarmLevelLink.
User skills required
- Solid knowledge of DataMiner protocols (table integration)
- Basic knowledge of DataMiner Cube
The use case
The goal of the example described below is to collect the aggregated alarm severities from different DataMiner elements that interact with data sources (i.e. data source elements).
The data source elements have two tables:
- Service Table (parameter ID = 1100).
- Alarm Table, containing the current alarms for each service in the Service Table (parameter ID = 1200).
The result of this is shown in an overview DataMiner element that does not interact with any data source (i.e. the overview element).
The overview element must display:
- A table overview of all data source elements with the associated alarm severity.
- A table overview of all unique services across the data source elements with their highest (aggregated) alarm severity.
How to
In order to aggregate the alarm severities based on a specific filter, it is important to understand the table definition used in the data source element protocol.
Service Table: parameter ID = 1100
- Column 1: parameter ID = 1101, used as primary key (value = 1, 2, 3, 4 , etc.).
- Column 2: parameter ID = 1102, used as display key as this represents the name of the service (value = ALTERA, CONTINUA, EVCC, RED, etc.).
Alarm Table: parameter ID = 1200
- Column 1: parameter ID = 1201, used as primary key (value = 1, 2, 3, 4, etc.).
- Column 2: parameter ID = 1202, used as the monitored value (alarm template is active).
- Column 3: parameter ID = 1203, used as foreign key to the associated service (value = primary key of the service).
- Column 4: parameter ID = 1204, representing the associated service name.
The relation between the two tables (via the foreign key) is set as follows (the order of the path is of less importance as the alarm bubble-up is defined separately).
<Relations>
    <Relation path="1100;1200"/>
</Relations>
In order to aggregate alarms from the Alarm Table on service level, the severity must be passed using SeverityBubbleUp. This will make sure that, internally, the Service Table object has knowledge of the aggregated severity of the alarms in the linked Alarm Table.
<SeverityBubbleUp>
    <Path>1200;1100</Path> <!-- From Alarms to Services-->
</SeverityBubbleUp>
The overview element will contain tables that will retrieve the alarm severities from the selected data source elements. For this example, all the elements using a specific protocol are detected and listed in a table. This could also be a configuration that was loaded. No matter how the data is collected, in the end you will require a table that contains the element name and the DataMiner element ID.
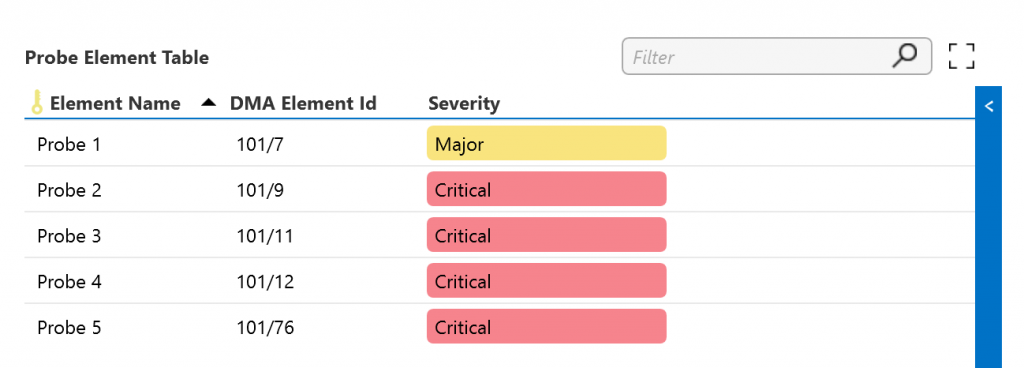
For example, a Probe Element Table:

The table parameter ID = 100, with the following columns:
- Element Name (parameter ID = 101), filled by logic other than via alarm level linking.
- DMA Element ID (parameter ID = 102), filled by logic other than via alarm level linking.
- Severity (parameter ID = 103), retrieved via alarm level linking.
In order to have the aggregated severity of the element filled in, you need to define an alarm level link.
<AlarmLevelLinks>
    <!-- Severity per Element -->
    <AlarmLevelLink id="1" remoteElement="102:-1" destination="103"/>
</AlarmLevelLinks>
As you can see, the remoteElement will use the column parameter ID of this Probe Element Table that contains the DataMiner element ID of the data source element.
The -1 indicates that the overall element severity is required. The result is placed in the Severity column of the table via the destination.
The overview element also needs to display the aggregated alarms per service. For this purpose, another table will be needed as well as an extra alarm level link definition.

The table parameter ID = 200, with the following columns:
- Instance (parameter ID = 201), used as primary key and filled by logic other than via alarm level linking.
- Name (parameter ID = 202), used as display key and filled by logic other than via alarm level linking.
- Severity (parameter ID = 203), retrieved via alarm level linking.
Like in the previous table, the Names must be added using logic other than via alarm level linking. This will result in the mapping of the services that can be used to retrieve the aggregated alarm severities.
<AlarmLevelLinks>
    <!-- Severity per Element -->
    <AlarmLevelLink id="1" remoteElement="102:-1" destination="103"/>
    <!-- Severity per Service -->
    <AlarmLevelLink id="2" remoteElement="102:1100:1102" destination="204:DISPLAY_NOLINK:202"/>
</AlarmLevelLinks>
In this second link, the remoteElement attribute will define:
- Which element to use: value in column 102 of the Probe Element Table.
- Which table to use in the remote element: Service Table with parameter ID 1100.
- Which column of the remote table contains the name of the available services: parameter ID 1102.
The destination will include the column that will be used to compare with the remote table column (Service Name):
- Where to store the result: column 204.
- How to map the data: use the service name value (via the display key) that is available in column 202.
Because of the alarm bubble-up in the data source element, the aggregated alarm severity per service is available in the Service Table or the data source element. This way, the alarm level link can display the result in the row of the Service Overview Table in the overview element that matches the service name.