How to use the element log in connector integrations
Below, you can lear how to use the element log to help with development or investigations.
User skills required
- Basic knowledge of protocols.
- Basic knowledge of DataMiner Cube.
How to
Viewing the element log
You can either open the element log in DataMiner Cube or open it directly in the File Explorer on the DataMiner Agent.
DataMiner Cube:
- Go to Apps > System Center > Logging > Element, and select the element in question.
- Alternatively, on the element card, click the hamburger button to open the card menu and select View > Log.
File Explorer:
- Go to
C:\Skyline DataMiner\Loggingand select the text file with the name of the element.
- Go to
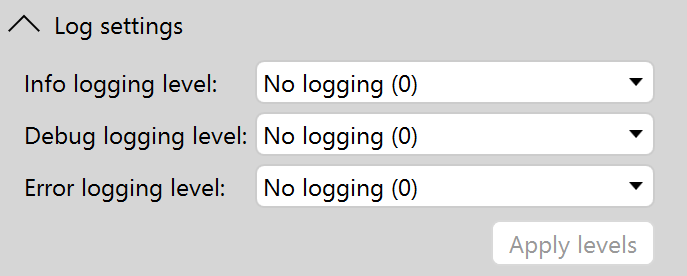
Changing the log settings
By changing the log settings, you can have more or fewer details included in the log file for three different types of logging:
- Info: More detailed information for debugging purposes, e.g., start or end of a procedure, the changing of a parameter, etc.
- Debug: More detailed information, typically describing the normal way of working, e.g., QAction was triggered, initializing of the element during startup, etc.
- Error: Any errors or exceptions that occur. These can also be found in SLErrors.txt.
The protocol developer decides which of these types a specific log line will use.
When a specific level is selected, e.g., level 3, this will show all the log lines linked to this level and lower. For example, a log line using info of logging level 3 can look like this:
[DATE]|[TIME]|SLProtocol - 15968 - DMA01 |9228|CQAction::Run|INF|2|QAction [100] triggered by ...
In this line, you can see "|INF|2|", which indicates that the line is an "info" type log line that is shown when the level is 2 or higher.
The only exception to this is when a log line is explicitly defined to always be shown regardless of the log level. See Always showing a log line below.
Adding log lines
By default, DataMiner will always add certain info to the log file. For example, when an element is started up, this is always mentioned in the log, regardless of how a user configures the log settings. This data is displayed between the below log lines, indicating that the user configuration of the settings is ignored:
SLLog|ApplyLogLevels|CRU|-1|Log Levels: Info: 5; Error: 5; Debug: 5 (init)
...
SLLog|ApplyLogLevels|CRU|-1|Log Levels: Info: 0; Error: 0; Debug: 0 (custom)
To add your own log lines, you need a QAction executing the Log method in the protocol. For example, this will generate a debug log line and display it as soon as the level is set to "No logging (0)":
protocol.Log("My log line.", LogType.DebugInfo, LogLevel.NoLogging);
Caution
The method is always executed. Based on the settings, the log line will either be added in the file or not. To avoid unnecessary load on the system, only use this method when a log line is useful. Also take care to use the most optimal logging type and level to assist the person reading the log file.
With this method, you can define the log type and the log level. The line will be visible in the log file when the log settings are configured to show the specified type and level (or a higher level).
[DATE]|[TIME]|SLManagedScripting.exe|ManagedInterop|DBG|0|My log line.
In this line, you can see that SLManagedScripting wrote the log line. This is the process responsible for running the QAction. As this is the only way you can add your own log lines, these are easy to find.
"|DBG|0|" indicates that LogType is defined as Debug and LogLevel as NoLogging (0).
Always showing a log line
To always have a log line shown, use the LogType Always. For example, the log line below is always shown even when the log level in the log settings is set to "No Logging" and the QAction log method indicated it as LogLevel LogEverything (5).
[DATE]|[TIME]|SLManagedScripting.exe|ManagedInterop|CRU|5|My log line.
In this line, "CRU|5|" indicates that LogType is defined as Always and LogLevel as Log Everything (5).
Adding an error log entry
Error logging should only be used for when something goes wrong. This could for example be logic that breaks for an unknown reason or data that no longer has the expected format. Whenever this occurs, it should be indicated as an error so that it will not only be displayed in the element log, but also in the protocol errors log file Errors In Protocol. This file shows all the error log lines from all the running elements on the DataMiner Agent. This includes native errors (written by DataMiner) and error log lines defined in the connector itself (written by QActions).
You can find this log file in DataMiner Cube by going to Apps > System Center > Logging > DataMiner > Errors In Protocol.
To add an error log entry, use LogType Error in the protocol:
protocol.Log("My log line.", LogType.Error, LogLevel.NoLogging);
public static void Run(SLProtocol protocol)
{
    try
    {
        // Do something.
    }
    catch (Exception ex)
    {
        string logLine = string.Format("QA{0}|{1}|Run|Exception thrown:{2}", protocol.QActionID, protocol.GetTriggerParameter(), Environment.NewLine + ex);
        protocol.Log(logLine, LogType.Error, LogLevel.NoLogging);
    }
}
Preparing for debugging
As you should always reduce the amount of logging to a minimum to reduce the load and increase readability of the log file, it can become difficult to investigate a problem, especially in case the problem no longer occurs after an element restart.
To help prepare for these kinds of situations, you can add extra logic in the connector that will start writing extra logging on request, e.g., the different steps of a complex flow. To do so:
- Create a configurable (read and write) parameter Debug Mode with the values Disabled (0) and Enabled (1).
- Make sure that the Debug Mode parameter is by default set to Disabled.
- Create a new method to write debug log lines that will help investigations. e.g., the different steps in a flow.
- This new method will only write to the log when Debug Mode is set to Enabled.
To get the extra logging to investigate e.g., the steps in a complex flow, you only need to enable the Debug Mode parameter, and extra logging will be added without the need to change the protocol and restart the element. This method is commonly used when the protocol contains complex or very specific workflows, as it provides an easy means to know what is currently going on.
Caution
Writing too much logging in a short time will affect the system load. So do not forget to turn off the extra logging after your investigation, so the requests to write the logs are stopped and the log file size will stop growing.
For example:
public static void WriteDebugLog(this SLProtocol protocol, bool debugMode, string message)
{
    if(debugMode)
    {
        protocol.Log(
        string.Format("QA{0}|{1}", protocol.QActionID, message), LogType.DebugInfo, LogLevel.NoLogging);
    }
}
To use it:
bool debugMode = Convert.ToBoolean(Parameter.debugmode);
protocol.WriteDebugLog(debugMode, "Step 1 ...");
protocol.WriteDebugLog(debugMode, "Step 2 ...");
Where Parameter.debugmode is a read parameter that can be changed via a write parameter:
<Param id="10" trending="true">
    <Name>debugMode</Name>
    <Description>Debug Mode</Description>
    <Type>read</Type>
    <Information>
        <Subtext>Configurable setting to enable or disable extra logging to be stored in the element log file.</Subtext>
    </Information>
    <Interprete>
        <RawType>numeric text</RawType>
        <Type>double</Type>
        <LengthType>next param</LengthType>
    </Interprete>
    <Display>
        <RTDisplay>true</RTDisplay>
        <Positions>
            <Position>
                <Page>Config</Page>
                <Column>0</Column>
                <Row>0</Row>
            </Position>
        </Positions>
    </Display>
    <Measurement>
        <Type>discreet</Type>
        <Discreets>
            <Discreet>
                <Display>Disabled</Display>
                <Value>0</Value>
            </Discreet>
            <Discreet>
                <Display>Enabled</Display>
                <Value>1</Value>
            </Discreet>
        </Discreets>
    </Measurement>
</Param>
<Param id="60" setter="true">
    <Name>debugMode</Name>
    <Description>Debug Mode</Description>
    <Type>write</Type>
    <Interprete>
        <RawType>numeric text</RawType>
        <Type>double</Type>
        <LengthType>next param</LengthType>
    </Interprete>
    <Display>
        <RTDisplay>true</RTDisplay>
        <Positions>
            <Position>
                <Page>Config</Page>
                <Column>0</Column>
                <Row>0</Row>
            </Position>
        </Positions>
    </Display>
    <Measurement>
        <Type>discreet</Type>
        <Discreets>
            <Discreet>
                <Display>Disabled</Display>
                <Value>0</Value>
            </Discreet>
            <Discreet>
                <Display>Enabled</Display>
                <Value>1</Value>
            </Discreet>
        </Discreets>
    </Measurement>
</Param>