DataMiner Cube Feature Release 10.5.5
This Feature Release of the DataMiner Cube client application contains the same new features, enhancements, and fixes as DataMiner Cube Main Release 10.4.0 [CU14] and 10.5.0 [CU2].
Note
For known issues with this version, refer to Known issues.
Tip
- For release notes related to the general DataMiner release, see General Feature Release 10.5.5.
- For release notes related to the DataMiner web applications, see DataMiner web apps Feature Release 10.5.5.
Highlights
- EPM integration now fully available in DataMiner Cube [ID 22125] [ID 24896] [ID 26002] [ID 26232] [ID 29748] [ID 42221]
- System Center - SNMP forwarding: New option to prevent an SNMP manager from resending SNMP inform messages [ID 41885]
New features
EPM integration now fully available in DataMiner Cube [ID 22125] [ID 24896] [ID 26002] [ID 26232] [ID 29748] [ID 42221]
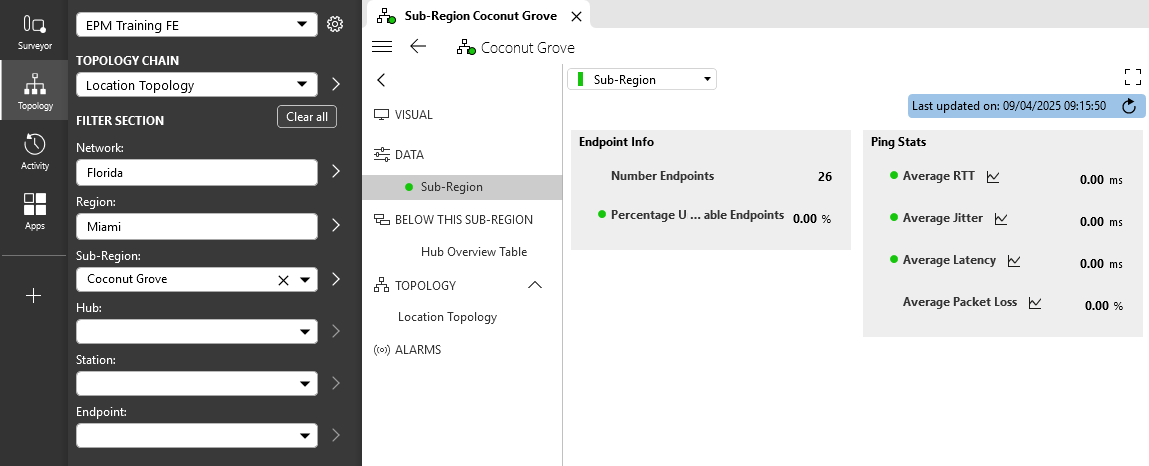
All EPM integration functionality that previously required the CPEIntegration soft-launch option is now fully available in DataMiner Cube. This allows you to access EPM data directly through the Cube UI, instead of only via an EPM Manager element. The data is available via a dedicated Topology pane in the Cube sidebar but can also be accessed via the Surveyor or the Alarm Console.
Topology pane
The most prominent new EPM integration feature is the Topology pane, which is also known as the Topology app. It is available via a new Topology button in the Cube sidebar, if the system contains at least one correctly configured EPM Manager element (as detailed below). Clicking the button will open a pane where you can select the frontend EPM Manager (in case more than one is available), select the topology chain, drill down to any of the topology levels in that chain, and open a card representing the data of the selected item. When you navigate between (docked) EPM cards, the filter selection will be updated to match the displayed card.
To make sure the Topology app is available, the following configuration is needed:
Make sure the DMS contains at least one frontend EPM Manager element.
For DataMiner Cube to detect these elements, they should be active, the type attribute of the Display tag in their connector should be set to "element manager", and they should contain a parameter named ElementManagerType set to 1.
The protocol of this element (which should be the same as for the corresponding backend elements) will describe a topology chain and its associated filters.
Go to System Center > System settings > EPM config, and add the frontend EPM Manager elements to the list.
In the Topology app, you will now be able to select the frontend managers and the corresponding topology chains.
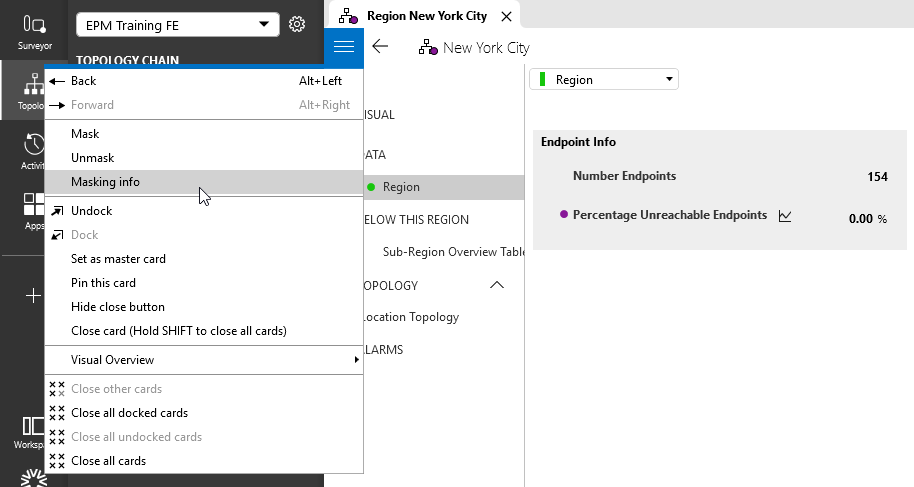
EPM masking info
If an EPM object in the topology is masked, you can get information on who masked it and when via the Masking info option in the hamburger menu of the Topology app:
System Type and System Name properties
For much of the EPM integration functionality, the system type and system name must be configured in EPM Manager protocols. The system type is configured with the name attribute of the Topologies.Topology.Cell tag, and the system name is configured with the columnPid attribute of the Topologies.Topology.Cell.Exposer.LinkedIds.LinkedId tag. For example, in the configuration below, Location is the system type, and the system name is the value from a cell in the column indicated by the specified column PID, which could for example be Miami:
<Topologies>
   <Topology>
      <Cell name="Location" table="500">
         <Exposer enabled="true">
            <LinkedIds>
               <LinkedId columnPid="1001">1000</LinkedId>
            </LinkedIds>
         </Exposer>
      </Cell>
   </Topology>
</Topologies>
This makes the System Type and System Name properties available in the system for e.g., alarm filtering, and it also allows you to link Visio shapes to EPM objects based on these properties using the SystemType and SystemName shape data fields.
In addition, you can link views to EPM rows by using the viewImpact table column option in the view tables of the EPM Manager protocol, and setting the System Type and System Name properties on the views. In the Surveyor, a circle will be added to the alarm icon for the view, showing the highest alarm severity of objects within the view:
![]()
Support for multiple frontend manager elements
Previously, the CPEIntegration soft-launch feature only allowed one frontend manager element. Now, multiple frontend elements are supported in one DataMiner System.
To configure this, make sure the system type for each frontend manager is unique, as it is the system type that now will be used to trace EPM objects back to their respective frontend managers. If you for example have an "HFC" and an "IOT" frontend EPM Manager in your system, these cannot both have a "Location" cell. Instead, you can prefix this, e.g., "HFC_Location" and "IOT_Location", respectively.
In addition, the frontend and backend elements for the same technology must use the same DataMiner protocol and version, as otherwise this may result in incorrect linking in the DataMiner Cube UI.
If these conditions are met, to start using the frontend EPM Managers, first define them in System Center via System settings > EPM config or via the cogwheel icon in the Topology app.
Important
Because of this change, some configuration changes may be required in systems that were previously using the CPEIntegration soft-launch option. Some existing solutions may not have a unique system type per EPM Manager protocol, or they may have frontend and backend manager elements with different protocols or protocol versions, which will no longer work correctly.
Customization of EPM integration data pages
The native look of the Data section of an EPM entity is two columns filled with all the information related to the row of the entity in the column order of the table. All columns that are configured to be shown are also shown in the Data section. If a column has a width of 0, it will not show in this section, and it will be impossible to view this column.
To further configure the look of the Data section and also add title boxes, you can put the parameters on one or more pages with the CPEIntegration/[CustomPageName] name, e.g., CPEIntegration/Region or CPEIntegration/Region Ping Stats.
On these pages, you can add parameters as you would on any other page, but you can also add individual column parameters associated with the entity. If you use the duplicateAs option, both the native and view table column will occupy the same space, but this will not cause issues in DataMiner.
If the CPEIntegration_ prefix is added to data pages in an EPM protocol, you can also apply a custom order for these pages in the pageOrder attribute of the Display tag in the protocol. For example:
<Display type="element manager" pageOptions="*;CPEOnly" defaultPage="General" pageOrder="General;Configurations;----------;CPEIntegration_Data/General;CPEIntegration_Data/Fiber;CPEIntegration_Data/Household;CPEIntegration_Data/Service Usage"/>
Custom Alarm Console hyperlinks to EPM object cards
It is now possible to configure custom hyperlinks for the Alarm Console context menu that will open EPM object cards. This is configured in Hyperlinks.xml, a similar way to the existing hyperlinks feature to open element, view, or service cards. However, the type for these new hyperlinks should be set to "OpenCPE".
For example, to add an "Open OLT" hyperlink to the Alarm Console context menu to open the EPM card of the object that generated the selected alarm, you can add the following configuration in the file:
<HyperLink name="Open OLT" menu="root" type="OpenCPE" version="2" id="18">:visual:pagename</HyperLink>.
Hyperlinks of this type can also be shown or hidden based on a filter configured with the filterElement attribute. For example:
<HyperLink filterElement="AlarmEventMessage.PropertiesDict."System Type"[String] == 'OLT'" name="Open OLT" menu="root" type="OpenCPE" version="2" id="18">[EID]:visual:qam ds</HyperLink>.
Agent caching configuration
Typically, when an exposed topology item is requested, every Agent in the cluster is requested to verify whether it contains data for that topology item, while typically only two to three Agents will actually contain that item. In a cluster with many Agents, this increases unnecessary remote calls and adds an unnecessary load on the Agents.
In such a case, you can now make an Agent store a full cache of where topology items are stored in the cluster, so that when this Agent (or an Agent connected to this Agent) receives a request for a topology item, only the Agents actually containing the data for the item will need to be contacted.
There is no limit as to how many Agents can hold such a cache, but keep in mind that depending on how many topology items are exposed in the system, this may increase the memory footprint of SLNet, and it will also add some extra syncing between Agents and forwarding of data from SLElement to SLNet when provisioning occurs.
This configuration will be stored in the TopologyItemHostingCacheState element of DataMiner.xml, for example:
<DataMiner>
...
   <TopologyItemHostingCacheState>true</TopologyItemHostingCacheState>
...
</DataMiner>
To enable this cache, in SLNetClientTest tool, after you have connected to the DMA, go to Advanced > CPE > TopologyItemHostingCache. You can then right-click any of the listed Agents to enable or disable the cache.
Caution
Always be extremely careful when using the SLNetClientTest tool, as it can have far-reaching consequences on the functionality of your DataMiner System.
Enhanced view configuration
It is now also possible to enhance a view so that it displays all the data pages of a specific element. This will for example allow you to create a view representing a particular EPM object, which will have the data pages for that object. Each view can only be combined with one element, which does not have to be included within that view.
To configure this, either use SLNetClientTest tool to send a EnhanceViewWithElementRequestMessage with the view ID and element ID you want to combine, or add the enhancedElement attribute to the view in Views.xml and set it to the relevant element ID. However, note that the latter requires a DataMiner restart.
To link all alarms of the enhancing element to the system object, fill in the general parameters Alarm System Type and Alarm System Name of this element with the correct system type and name. These values will then be set in the System Type and System Name properties of all alarms of this element.
System Center - SNMP forwarding: New option to prevent an SNMP manager from resending SNMP inform messages [ID 41885]
Up to now, when you stopped and restarted an SNMP manager, all open alarms would be resent. From now on, when you configure an SNMP manager, you will be able to prevent this by selecting the Enable tracking to avoid duplicate inform acknowledgments (ACKs) option. If you select this option, DataMiner will track which inform messages have been sent, and will not resend those that have already been acknowledged.
Note
This new Enable tracking to avoid duplicate inform acknowledgments (ACKs) option is not selected by default and is not compatible with the existing Resend all active alarms every: option. It is also not compatible with the Resend... command, which can be selected after right-clicking an SNMP manager in the SNMP forwarding section of System Center.
Sharing the link to the current Cube session with other users [ID 42389] [ID 42524]
If you want to share your current Cube session with another user, you can now copy the link to that session and send it to that user, who will then be able to paste it in the address box of a browser.
To copy the link to the current Cube session, do the following:
- Open the user menu by clicking the user icon in the upper-right corner of the screen.
- Click the Copy button next to the name of the DataMiner System.
When you hover over this Copy button, a tooltip will appear, saying that clicking this button will copy the link to the current session to the Windows clipboard.
Changes
Enhancements
DataMiner Cube desktop app: Enhanced configuration file management and revised drag-and-drop functionality [ID 41203]
In the DataMiner Cube desktop app, a number of enhancements have been made with regard to configuration file management.
Also, the drag-and-drop functionality has been revised. For example, it is now possible to reorder tile groups and to remove tiles by dragging them onto the recycle bin.
Profiles app will now show an error message when a create, update or delete operation fails [ID 41902]
When you used the Profiles module to create, update or delete a profile definition, a profile instance, a profile parameter, or a mediation snippet, up to now, you would not get notified when the operation failed. To find out why the operation failed, you had to consult the Cube logging.
From now on, whenever an error occurs while a create, update or delete operation is being performed, the Profiles module will open a dialog box showing an error message.
Alarm Console: Recursive loop detection in alarm trees [ID 42188]
From now on, when you right-click an alarm in the Alarm Console and select Show side panel, DataMiner Cube will check whether there are loops in the alarm tree, i.e., whether the alarm tree contains any alarms that refer to themselves.
Alarm Console: Multivariate pattern suggestion events will now be grouped into a single incident [ID 42287]
When a multivariate pattern is detected in new trend data, suggestion events are generated for every parameter in the linked pattern.
From now on, those suggestion events will be grouped into a single incident, which will be shown as a single line in both the Suggestion events tab and the Patterns tab of the Alarm Console.
Alarm templates: Warning message will now appear when you try to enable smart baselines for a history set parameter [ID 42326]
When you enable smart baselines for a parameter that has its historySet option set to true in the connector in question, from now on, a warning message will appear, saying that historySet functionality is incompatible with smart baselines.
Note
Although, in the UI, the smart baseline option will be enabled for the parameter in question, the option will have no effect as long as the parameter has its historySet option set to true in the connector.
System Center - System settings: 'Time to live' section will no longer be available when Cube is connected to a DMS using STaaS [ID 42333]
In System Center > System settings, the Time to live section will no longer be available when Cube is connected to a DMS using STaaS.
Trending: Miscellaneous enhancements [ID 42461]
A number of enhancements have been made with regard to trending.
The visibility of Y-axis curves in trend graph legends has been improved, and error and lock handling has been enhanced.
Trending: Enhanced selection of change points areas [ID 42488]
When a trend graph contained multiple overlapping change point areas, up to now, smaller areas could get covered by larger areas, making it impossible to select them. From now on, when you click a group of overlapping change point areas, the change point with the smallest time range will be selected.
Elements: New 'Block Swarming' option to indicate that an element is not allowed to swarm [ID 42536]
When you create or update an element, you will now be able to indicate that the element is not allowed to swarm to another host.
To do so, go to the Advanced section, and enable the Block Swarming option. By default, this option will be set to false.
If you try to swarm an element of which the Block Swarming option is set to true, then the error message Element is not allowed to swarm (blocked) will be displayed.
Note
In DataMiner Cube, this Block Swarming option will only be visible if Swarming is enabled in the DataMiner System.
Data Display: Enhanced performance when opening view cards [ID 42576]
Because of a number of enhancements, overall performance has increased when opening view cards.
Spectrum analysis: Auto-scale button at the top of a spectrum trace graph [ID 42597]
In the Spectrum Analyzer page of a spectrum analyzer card, you can now find an auto-scale button at the top of the spectrum trace graph.
Clicking this button will maximize and center the current trace based on minimum and maximum values.
This feature will only work if the spectrum element connector contains the following parameters:
- Reference Level (both read and write parameters)
- Amplitude Scale (both read and write parameters)
Fixes
Visual Overview: Placeholders would incorrectly broadcast the same value twice [ID 42252]
Up to now, in some cases, placeholder would incorrectly broadcast the same value twice.
Trending: Problem when loading trend data when the trend graph contained both regular average trend data and trend data related to SLAnalytics [ID 42357]
When a trend graph contained both regular average trend data and trend data related to SLAnalytics, in some rare cases, the trend graph could get stuck while loading that data.
Trending: Problem when you drilled down to a parameter from a Data Display subpage [ID 42373]
When you drilled down to a parameter by clicking a button on a Data Display subpage, in some cases, the trend graph would incorrectly be empty and the name of the parameter in both the title and the body of the window would be incorrect.
DataMiner Cube desktop app: Problem when pressing certain keys while entering a search string in the start window [ID 42437]
When, in the start window of the DataMiner Cube desktop app, you entered a search string in the search box and then pressed e.g., the left arrow key to position the cursor in the text you entered, up to now, the cursor would incorrectly not stay in the filter box. Instead, the key press would cause a different tile to be selected.
Also, when a certain group did no longer contain any tiles due to the filter you had entered, up to now, the empty group would incorrectly stay visible.
DMA selection box of duplicate element to be created would not be set to the correct DataMiner Agent [ID 42438]
When, in the Surveyor, you right-clicked a migrated or swarmed element, and selecting Duplicate, in the element card of the duplicate element to be created, the DMA selection box would not be set to the correct DataMiner Agent.
Protocols & Templates module: Problem when trying to open an information template using the right-click menu [ID 42462]
In the Protocols & Templates module, you can open an information template by either double-clicking it or right-clicking it and selecting Open.
Up to now, when you right-clicked and selected Open, Cube would incorrectly open the most recently selected alarm template or trend template instead.
System Center - Database: Offload configuration for real-time trending data displayed incorrectly [ID 42469]
When, while configuring trend data offloads, you selected Trend data and Enable data offload in the Offloads section, and then set the offload frequency to "permanently", this would be saved correctly, but displayed incorrectly in DataMiner Cube.
Alarm Console: Correlation alarms and incident alarms could appear twice in a newly created alarm tab [ID 42501]
When you created a new alarm tab, in some rare cases, correlation alarms or incident alarms would incorrectly appear twice in that tab: once with the correct base alarms and once without any base alarms.
Correlation : Correlation alarm triggered by another correlation alarm would not be shown as base alarm [ID 42541]
When a correlation rule created a correlated alarm that would trigger another correlation alarm that used the first correlated alarm as a base alarm, in some cases, the alarms would incorrectly not be shown as main alarm and base alarm, but as two separate correlated alarms.
Not possible to open parameter cards from the Search pane [ID 42552]
When, in the Search pane, you right-clicked a parameter in the search results and selected e.g., Open in new card, the parameter card would refuse to open.
DataMiner Cube desktop app: Problem when updating the configuration file [ID 42689]
In some cases, the DataMiner Cube desktop app could stop working when its configuration file was being updated.