Performance Analyzer app
Raw numbers can often be difficult to interpret, which is why the Performance Analyzer Solution provides a built-in low-code app to visualize the data collected by the solution. Using this app will make it much easier to make decisions based on the collected performance metrics.
To use this app, the Performance Analyzer library must have been implemented in the system.
Installing the Performance Analyzer app
To install the Performance Analyzer app, deploy the Performance Analyzer package from the Catalog.
Tip
See also: Deploying a Catalog item to your system.
Performance Analyzer app user interface
Components overview
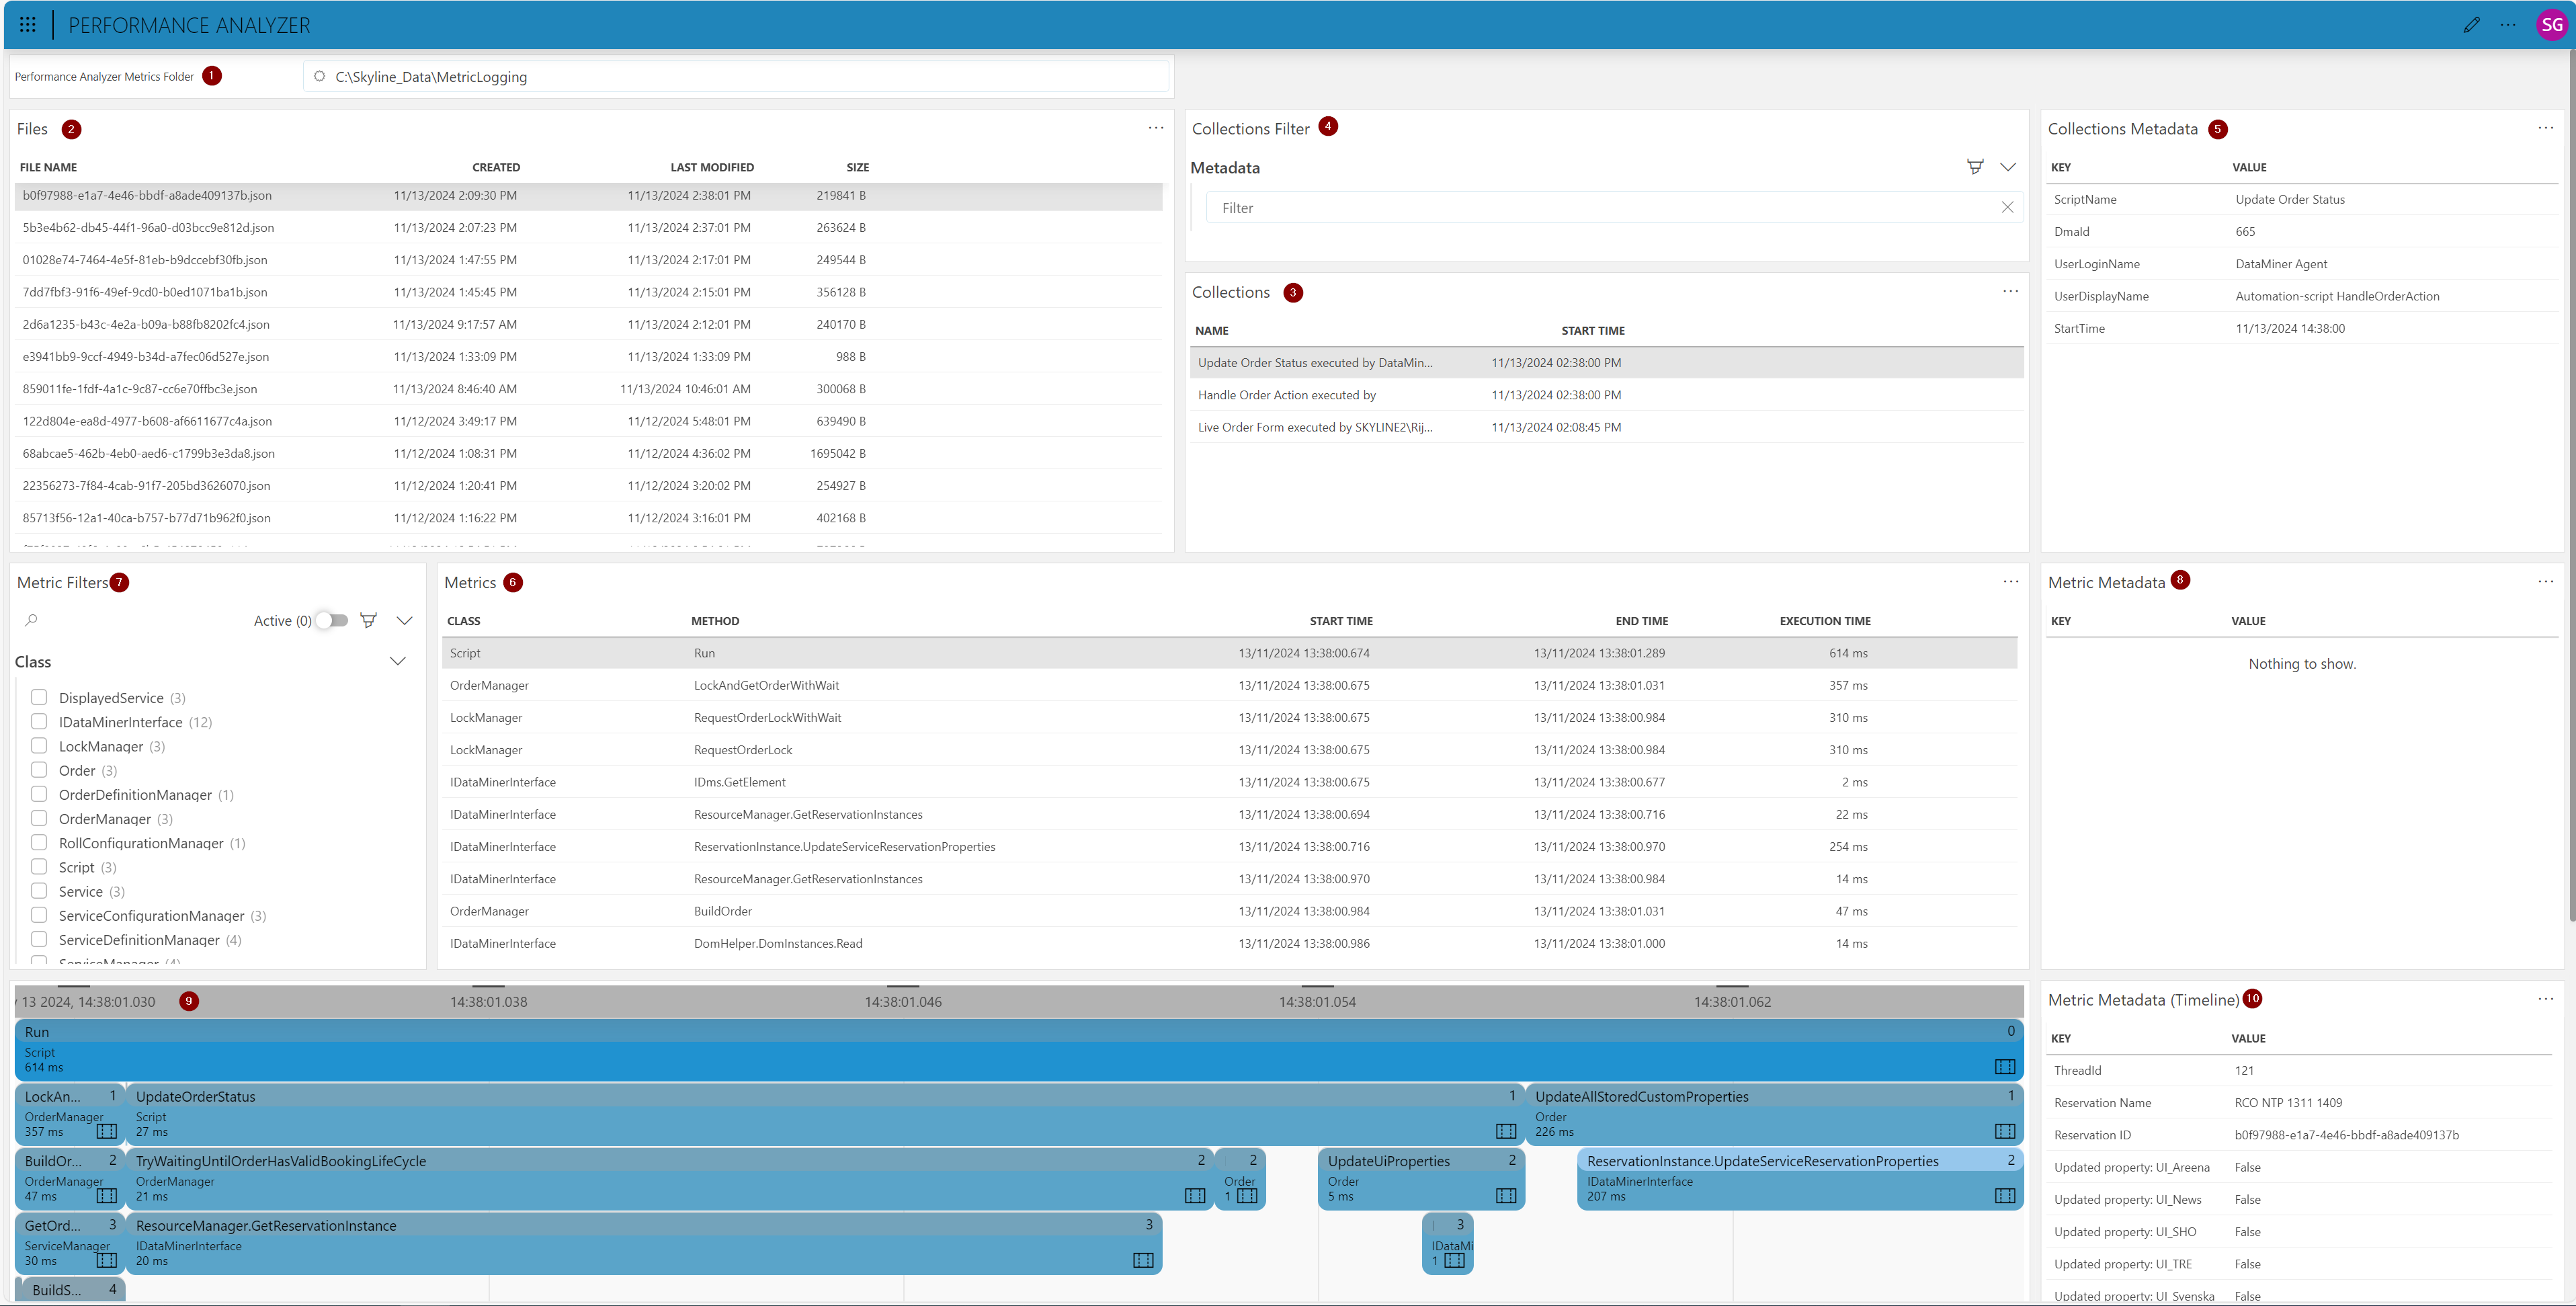
Below, you can find an overview of the main components of the app.

Performance Analyzer Metrics Folder: Defines the folder where performance data files are located. By default, this is
C:\Skyline_Data\PerformanceAnalyzer.Files: Shows a list of files available in the selected directory, with each file’s name, creation date, last modified date, and size. You can select a file in this list to analyze it in detail.
Collections: Displays a list of collections in the selected file. A "collection" refers to one disposal of the collector.
Collections Filter: Allows you to filter collections based on metadata, making it easy to locate a specific collection or understand its context.
Collection Metadata: Provides all the relevant details related to the context in which a collection was created.
Metrics: Provides a detailed list of individual metrics, each representing a specific operation or method call. The table includes information such as class, method, and start and end times, making it easier to identify which parts of the code impact the performance.
Metrics Filter: Allows you to filter metrics by specific classes, methods, execution time ranges, or metadata.
Metric Metadata: Provides more context information for the metrics, making it easier to understand them.
Timeline: Visual representation of every metric. You can focus on a specific block by double-clicking the corresponding table entry.
Metric Metadata (Timeline): Provides an overview of the context for the selected timeline block.
Metrics menu
Left-clicking a method in the Metrics table opens a menu with different options to visualize the execution times of the method.

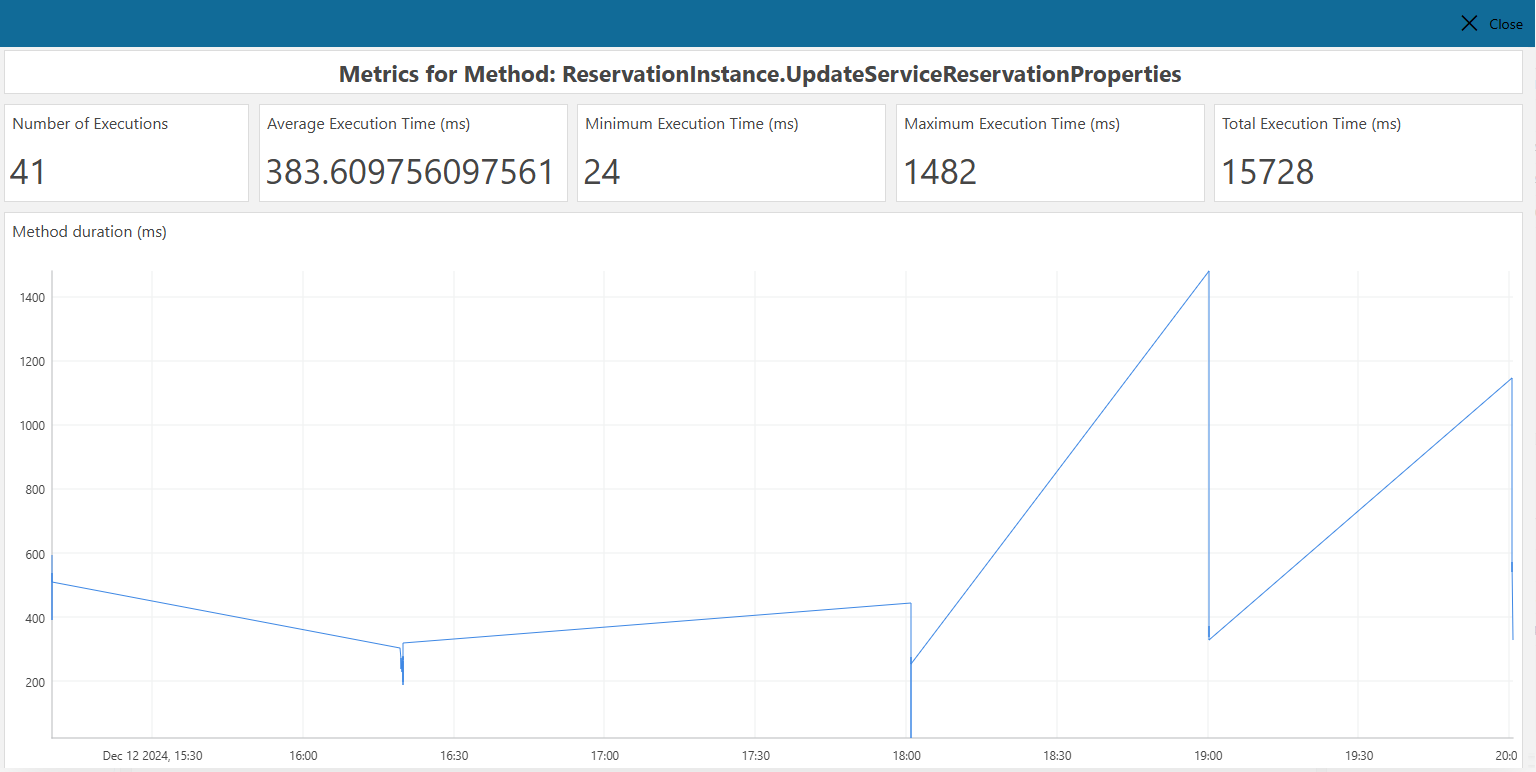
Analyze Method (File) displays statistics for the method in the file that is currently selected.

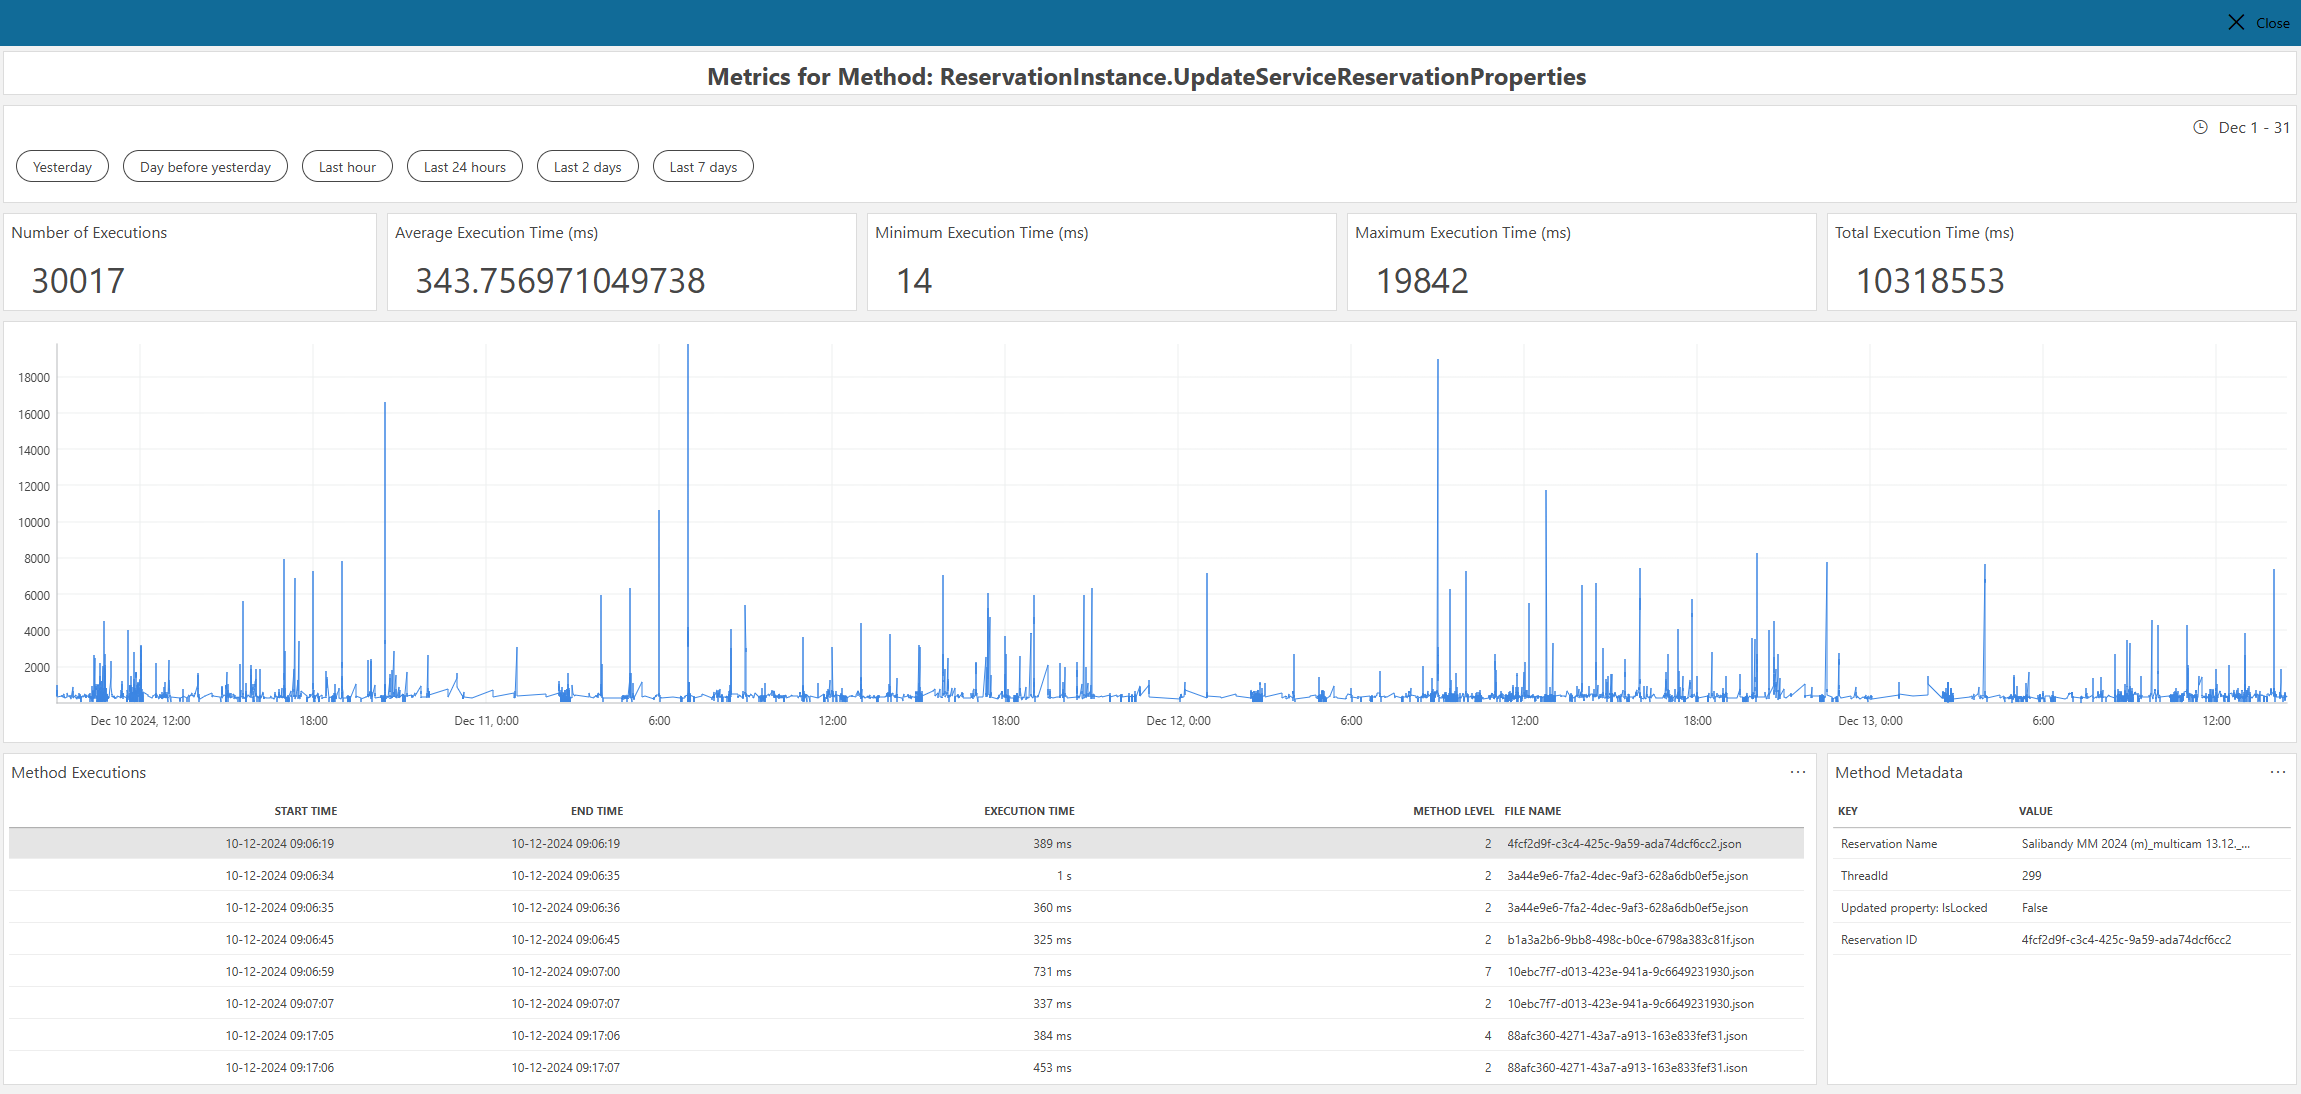
Analyze Method (Multi-File) displays statistics for the method across all files in the configured Performance Analyzer metrics folder.

Important
Analyzing a method across all files can cause a lot of memory and disk usage depending on the size of the metrics folder. A failsafe is implemented to load only the most recent 2 GB of files based on the last modified date.