Using the Techex TX Core app
The Techex TX Core app offers end-to-end monitoring and orchestration of the TX Core platform and TX Edges from a single pane of glass. Although this network orchestration solution package is still actively being improved and may not yet cover the full feature set of the TX Core and TX Edge products, it already enables off-the-shelf monitoring and orchestration of the Techex TX Core platform.
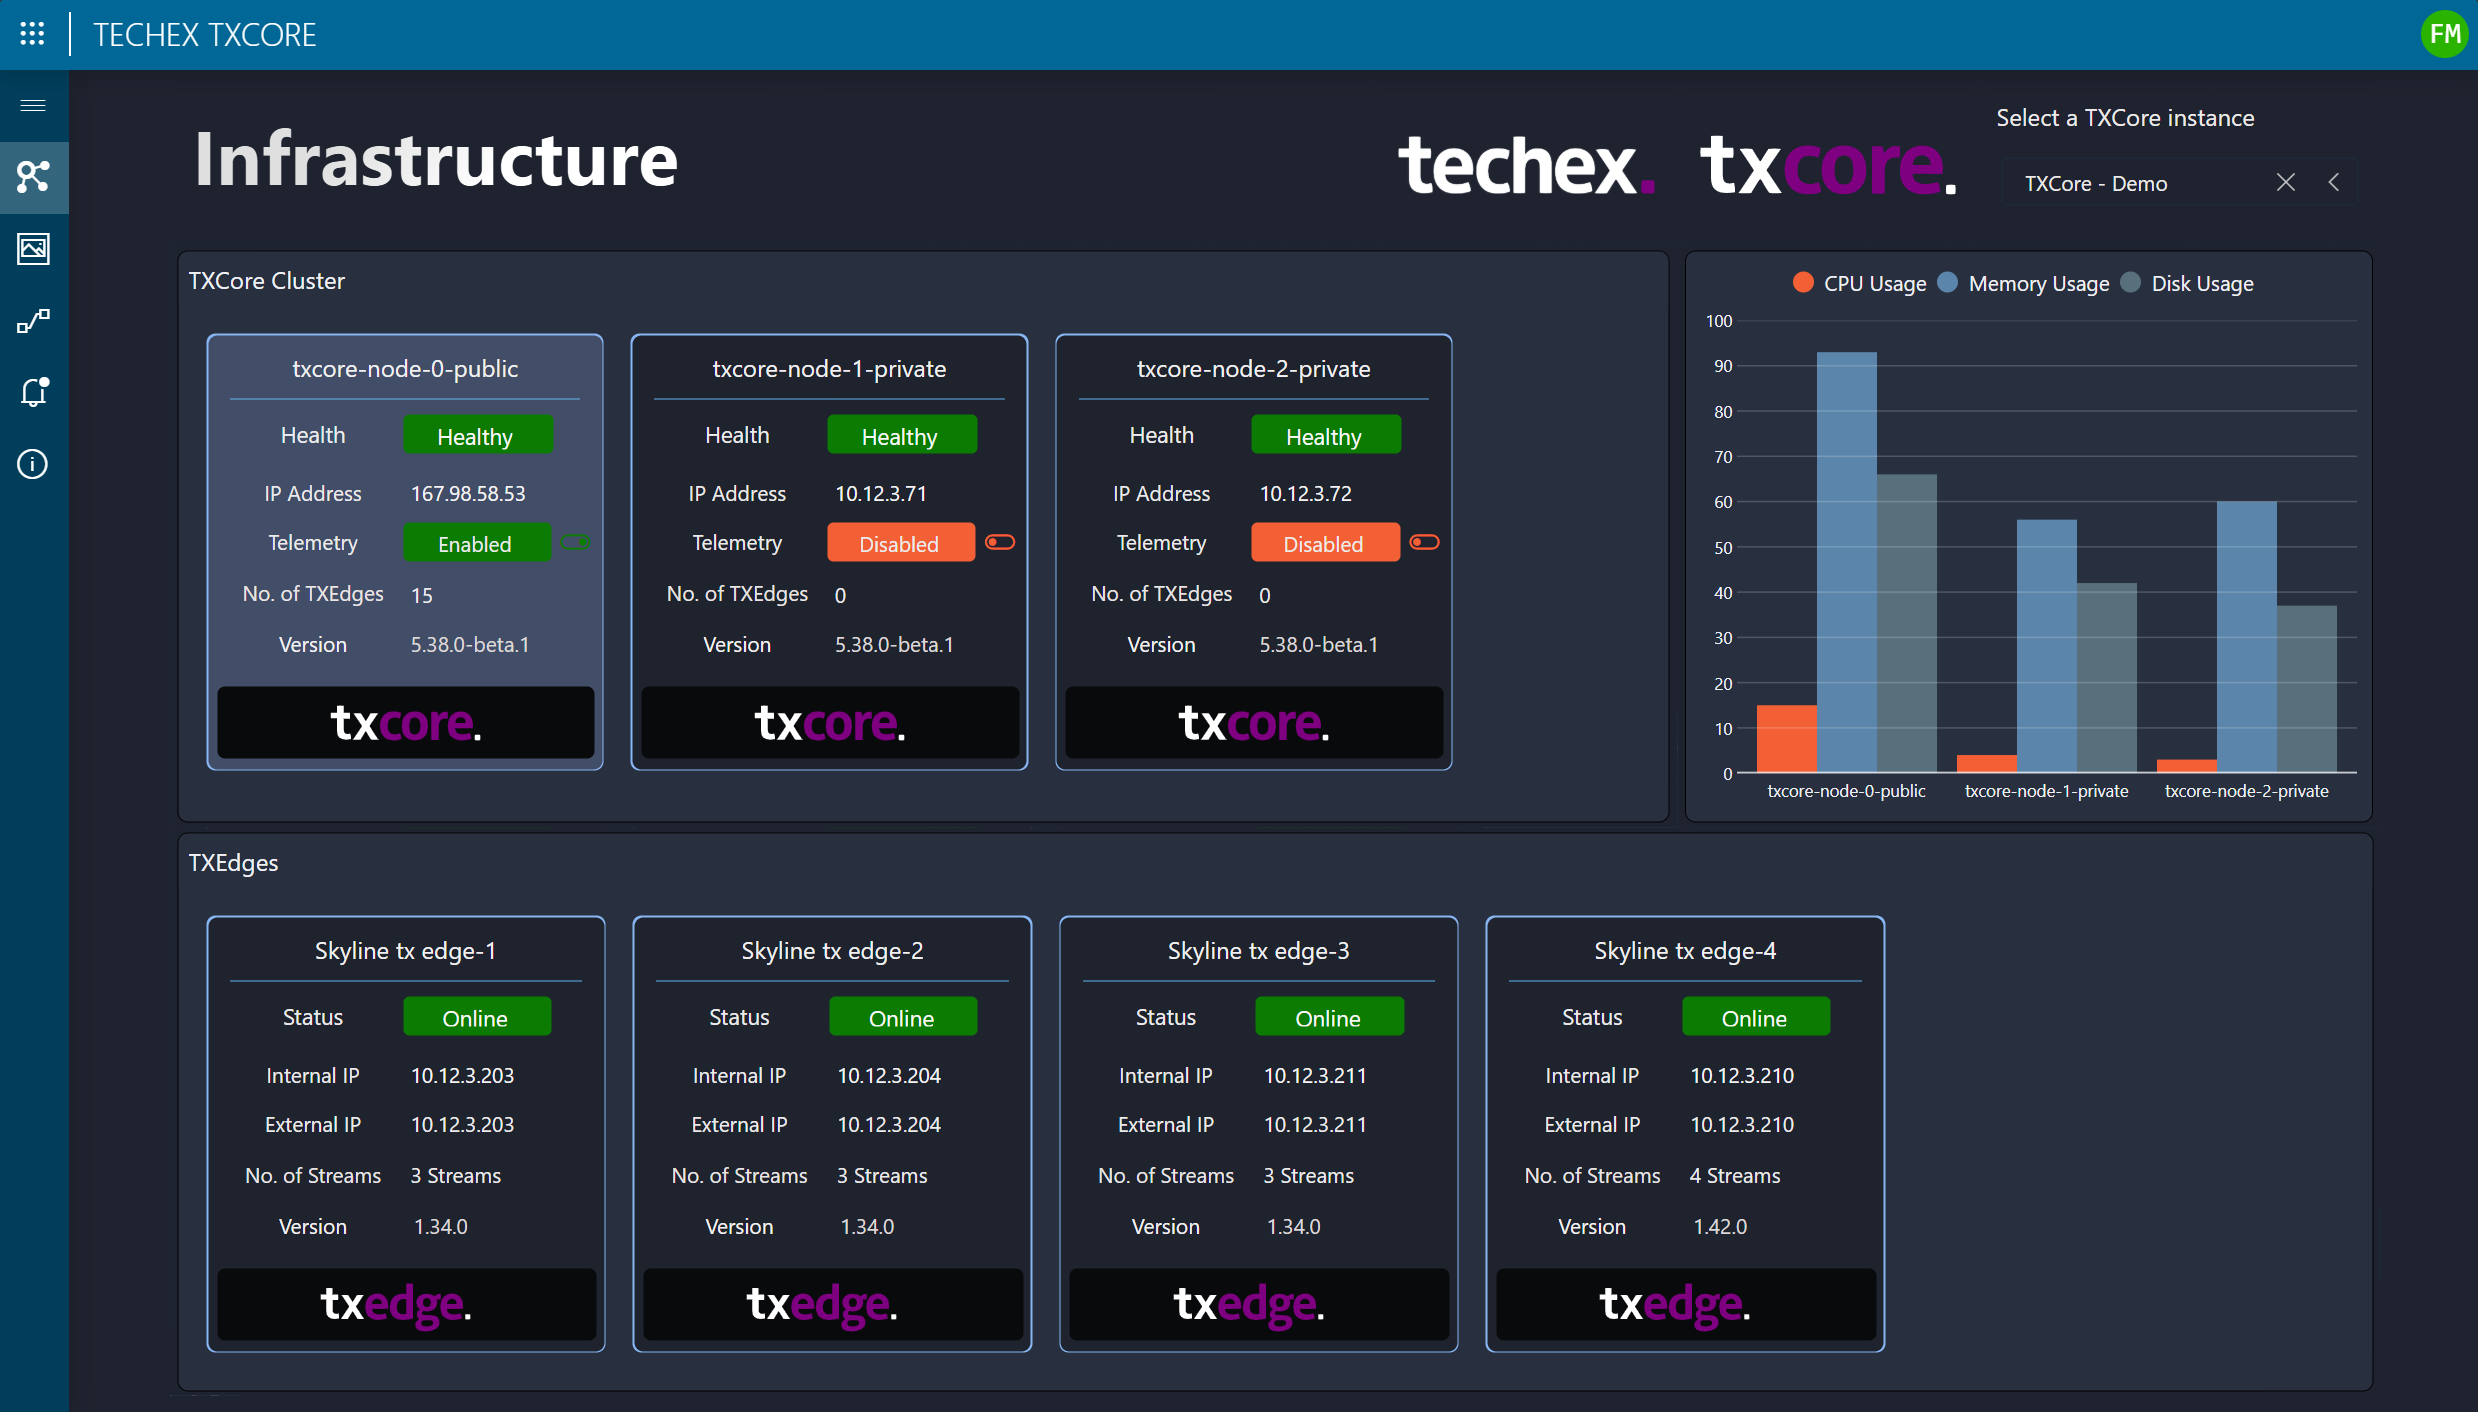
Infrastructure
On the landing page of the app, you can see the total number of TX Core and TX Edge instances, along with the health status of each instance. You can select a TX Core instance to filter the displayed TX Edges. From this page, you can monitor the cluster infrastructure, verify system uptime, and ensure proper connectivity between DataMiner and TX Core.
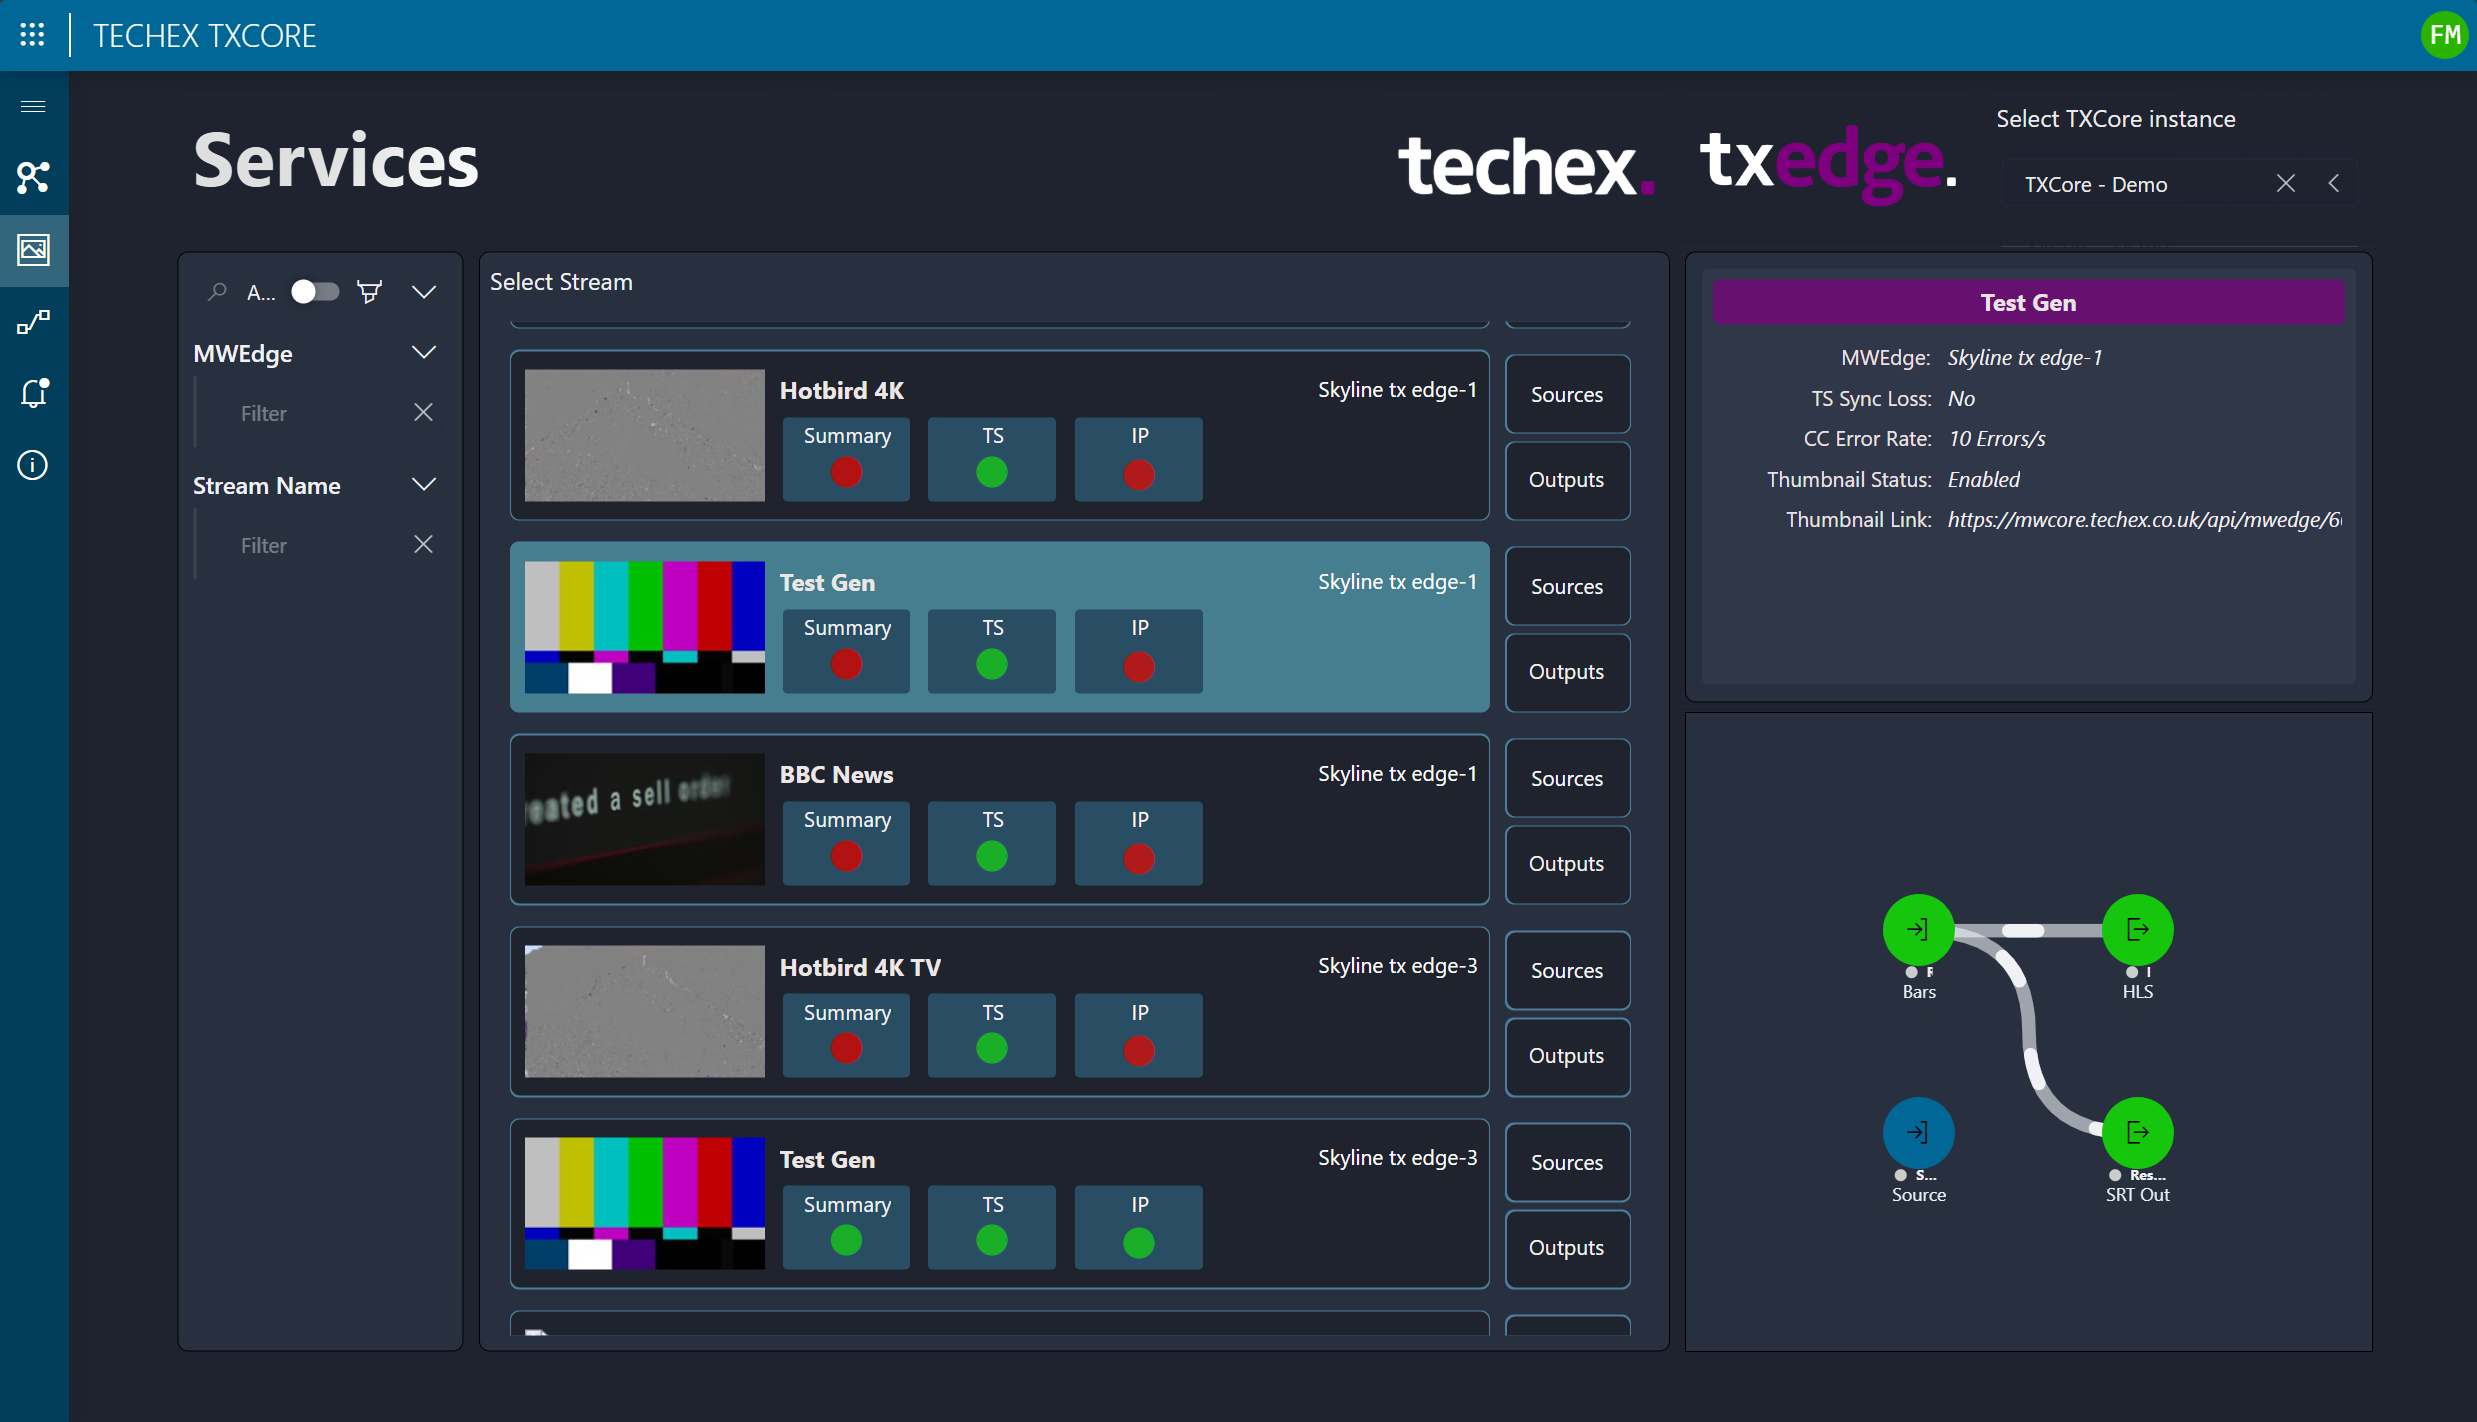
Services
On the Services page, you can find more details about each service across all TX Edge instances. This includes a summary of alarms across different layers, such as those related to the transport stream and IP layer. In the lower-right corner, the DataMiner node edge component has been used for a visual representation of the connectivity.
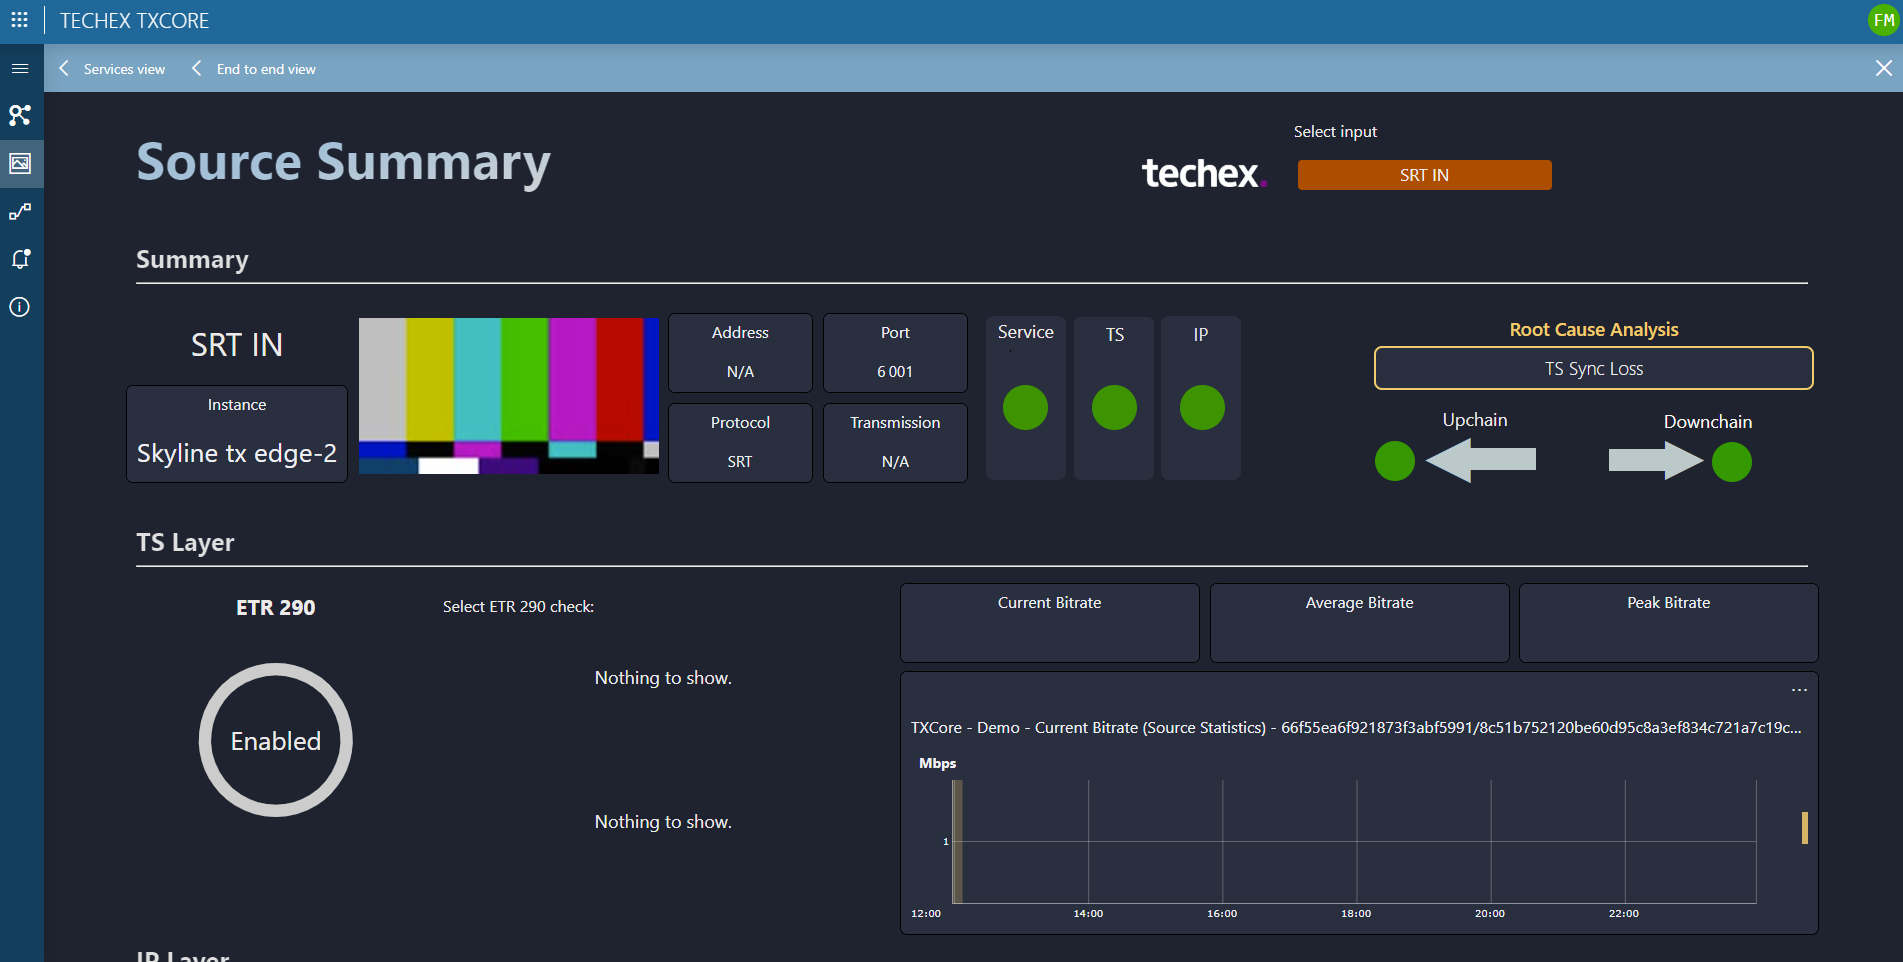
Source and Output Summary
When you double-click any source or destination, you will be redirected to the Node Summary page, which displays key parameters and metrics for source or output streams.
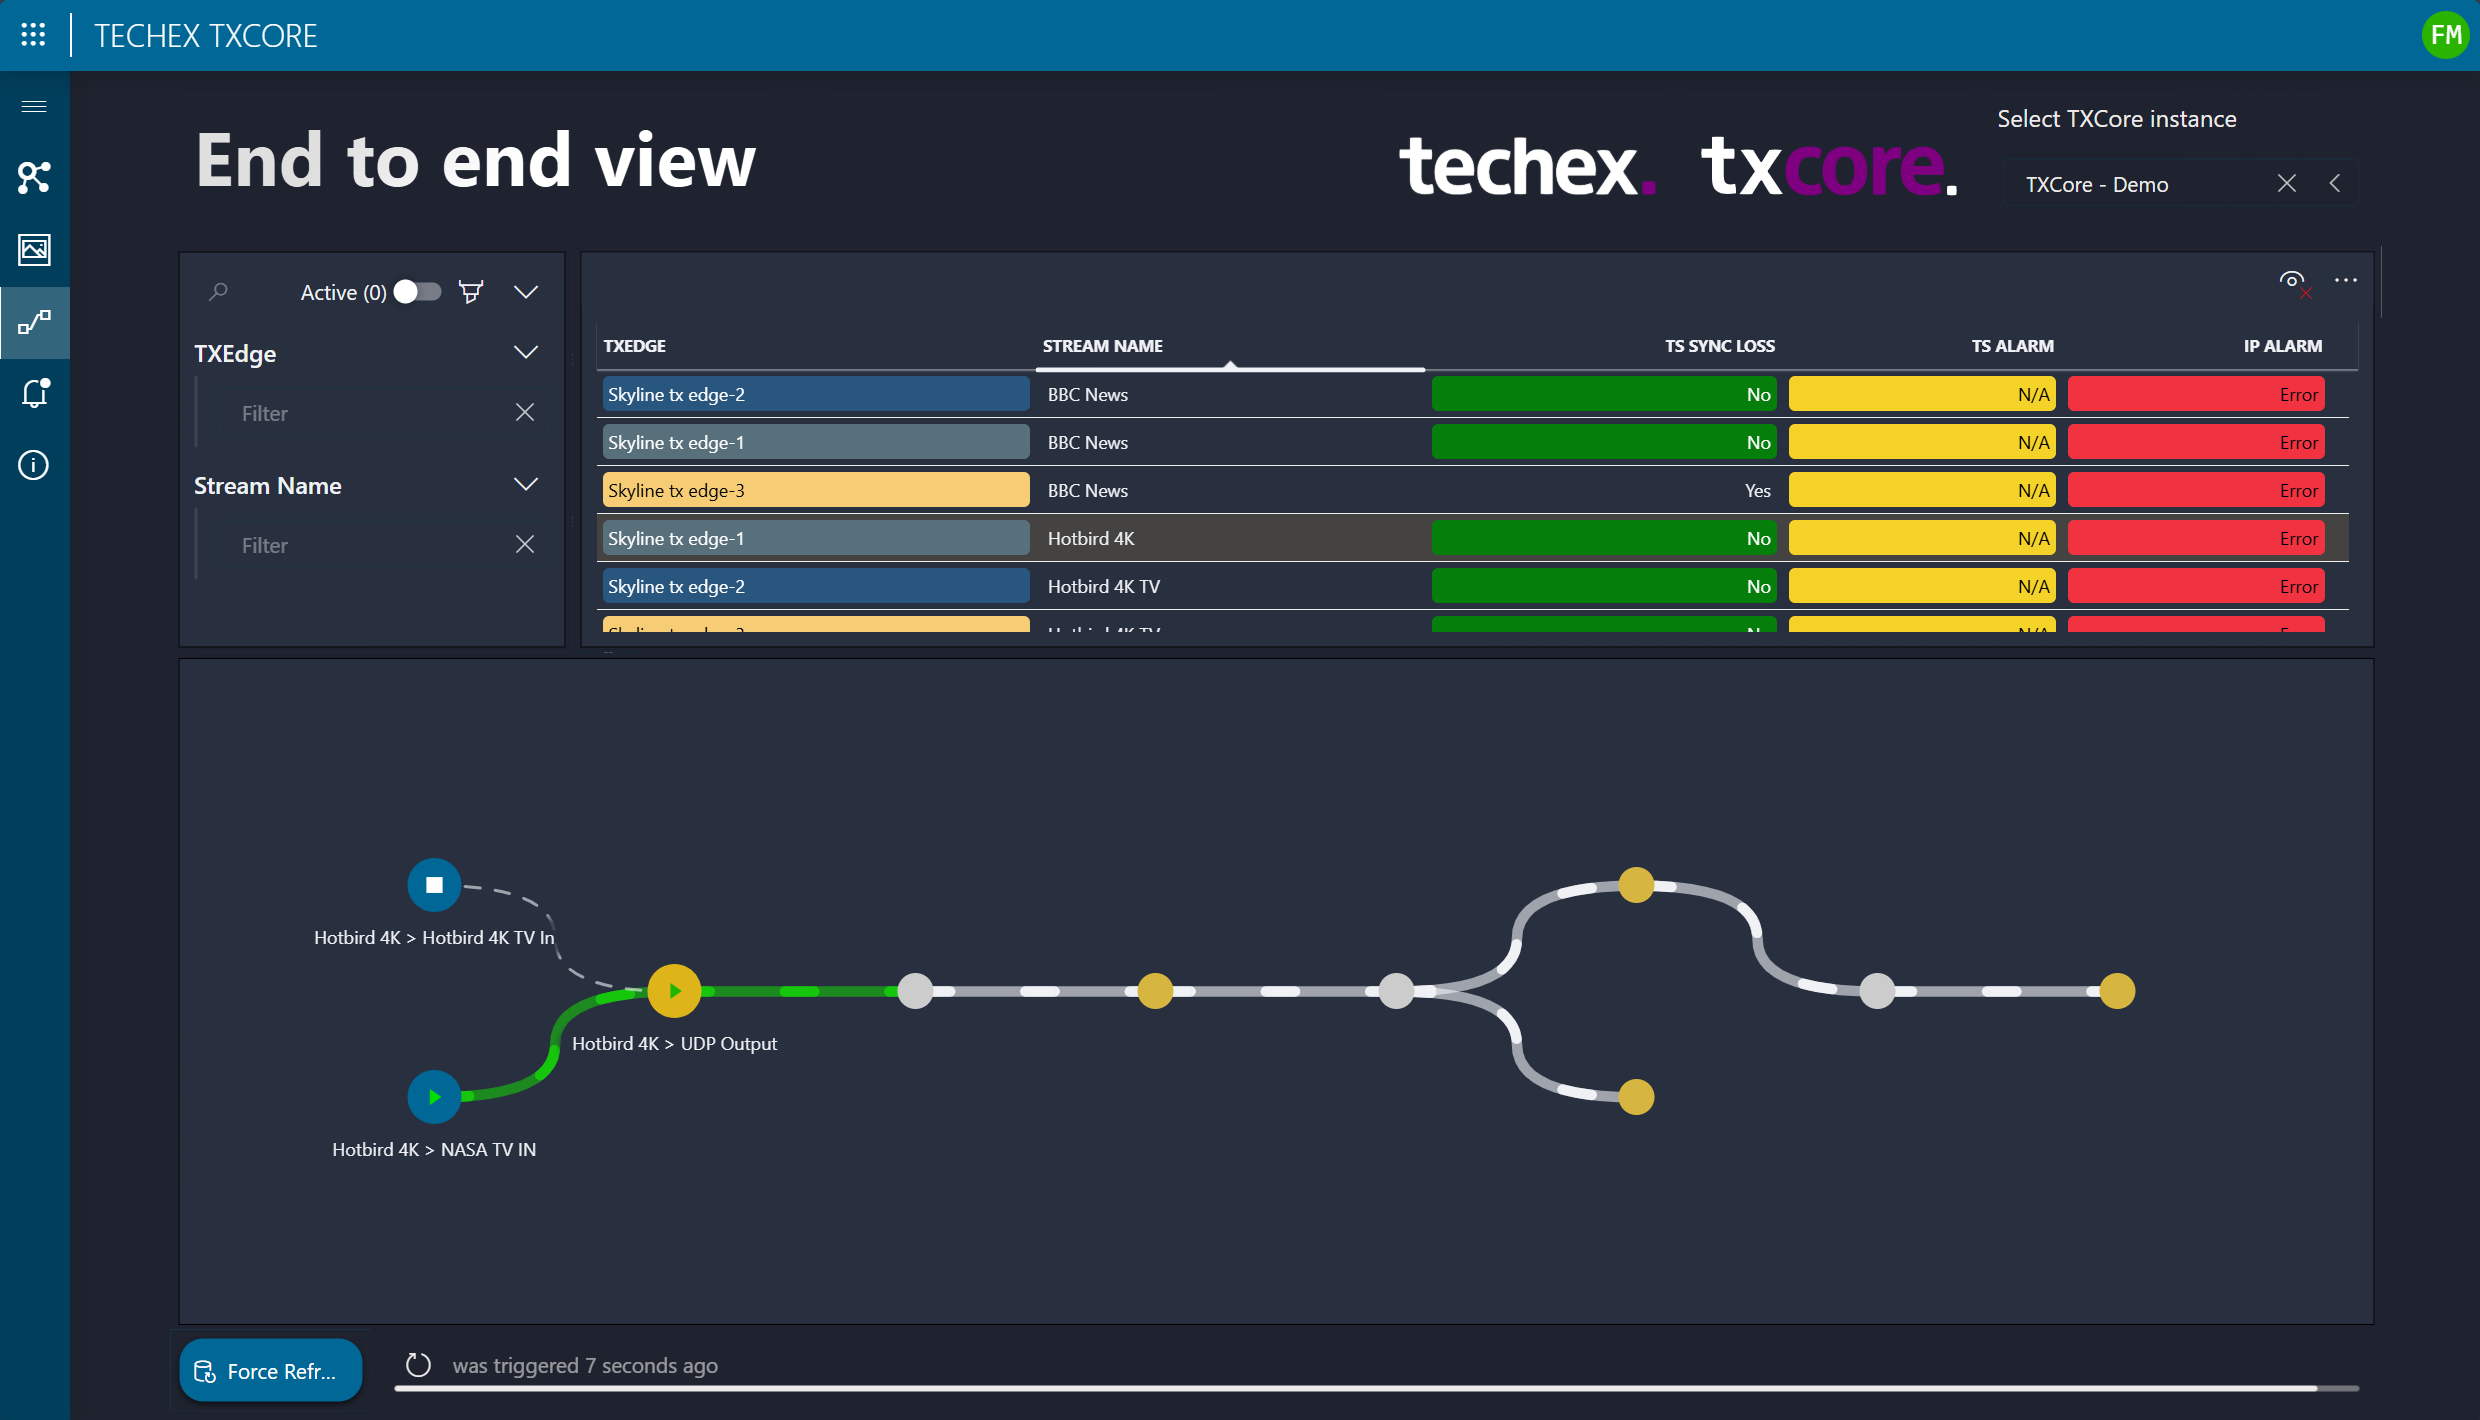
End-to-end view
What sets this app apart is the end-to-end view. DataMiner automatically calculates the connectivity of each service across multiple TX Edge instances, allowing you to track your streams from their source all the way to their final destination. Controls have also been incorporated to stop and resume streams or trigger failover.
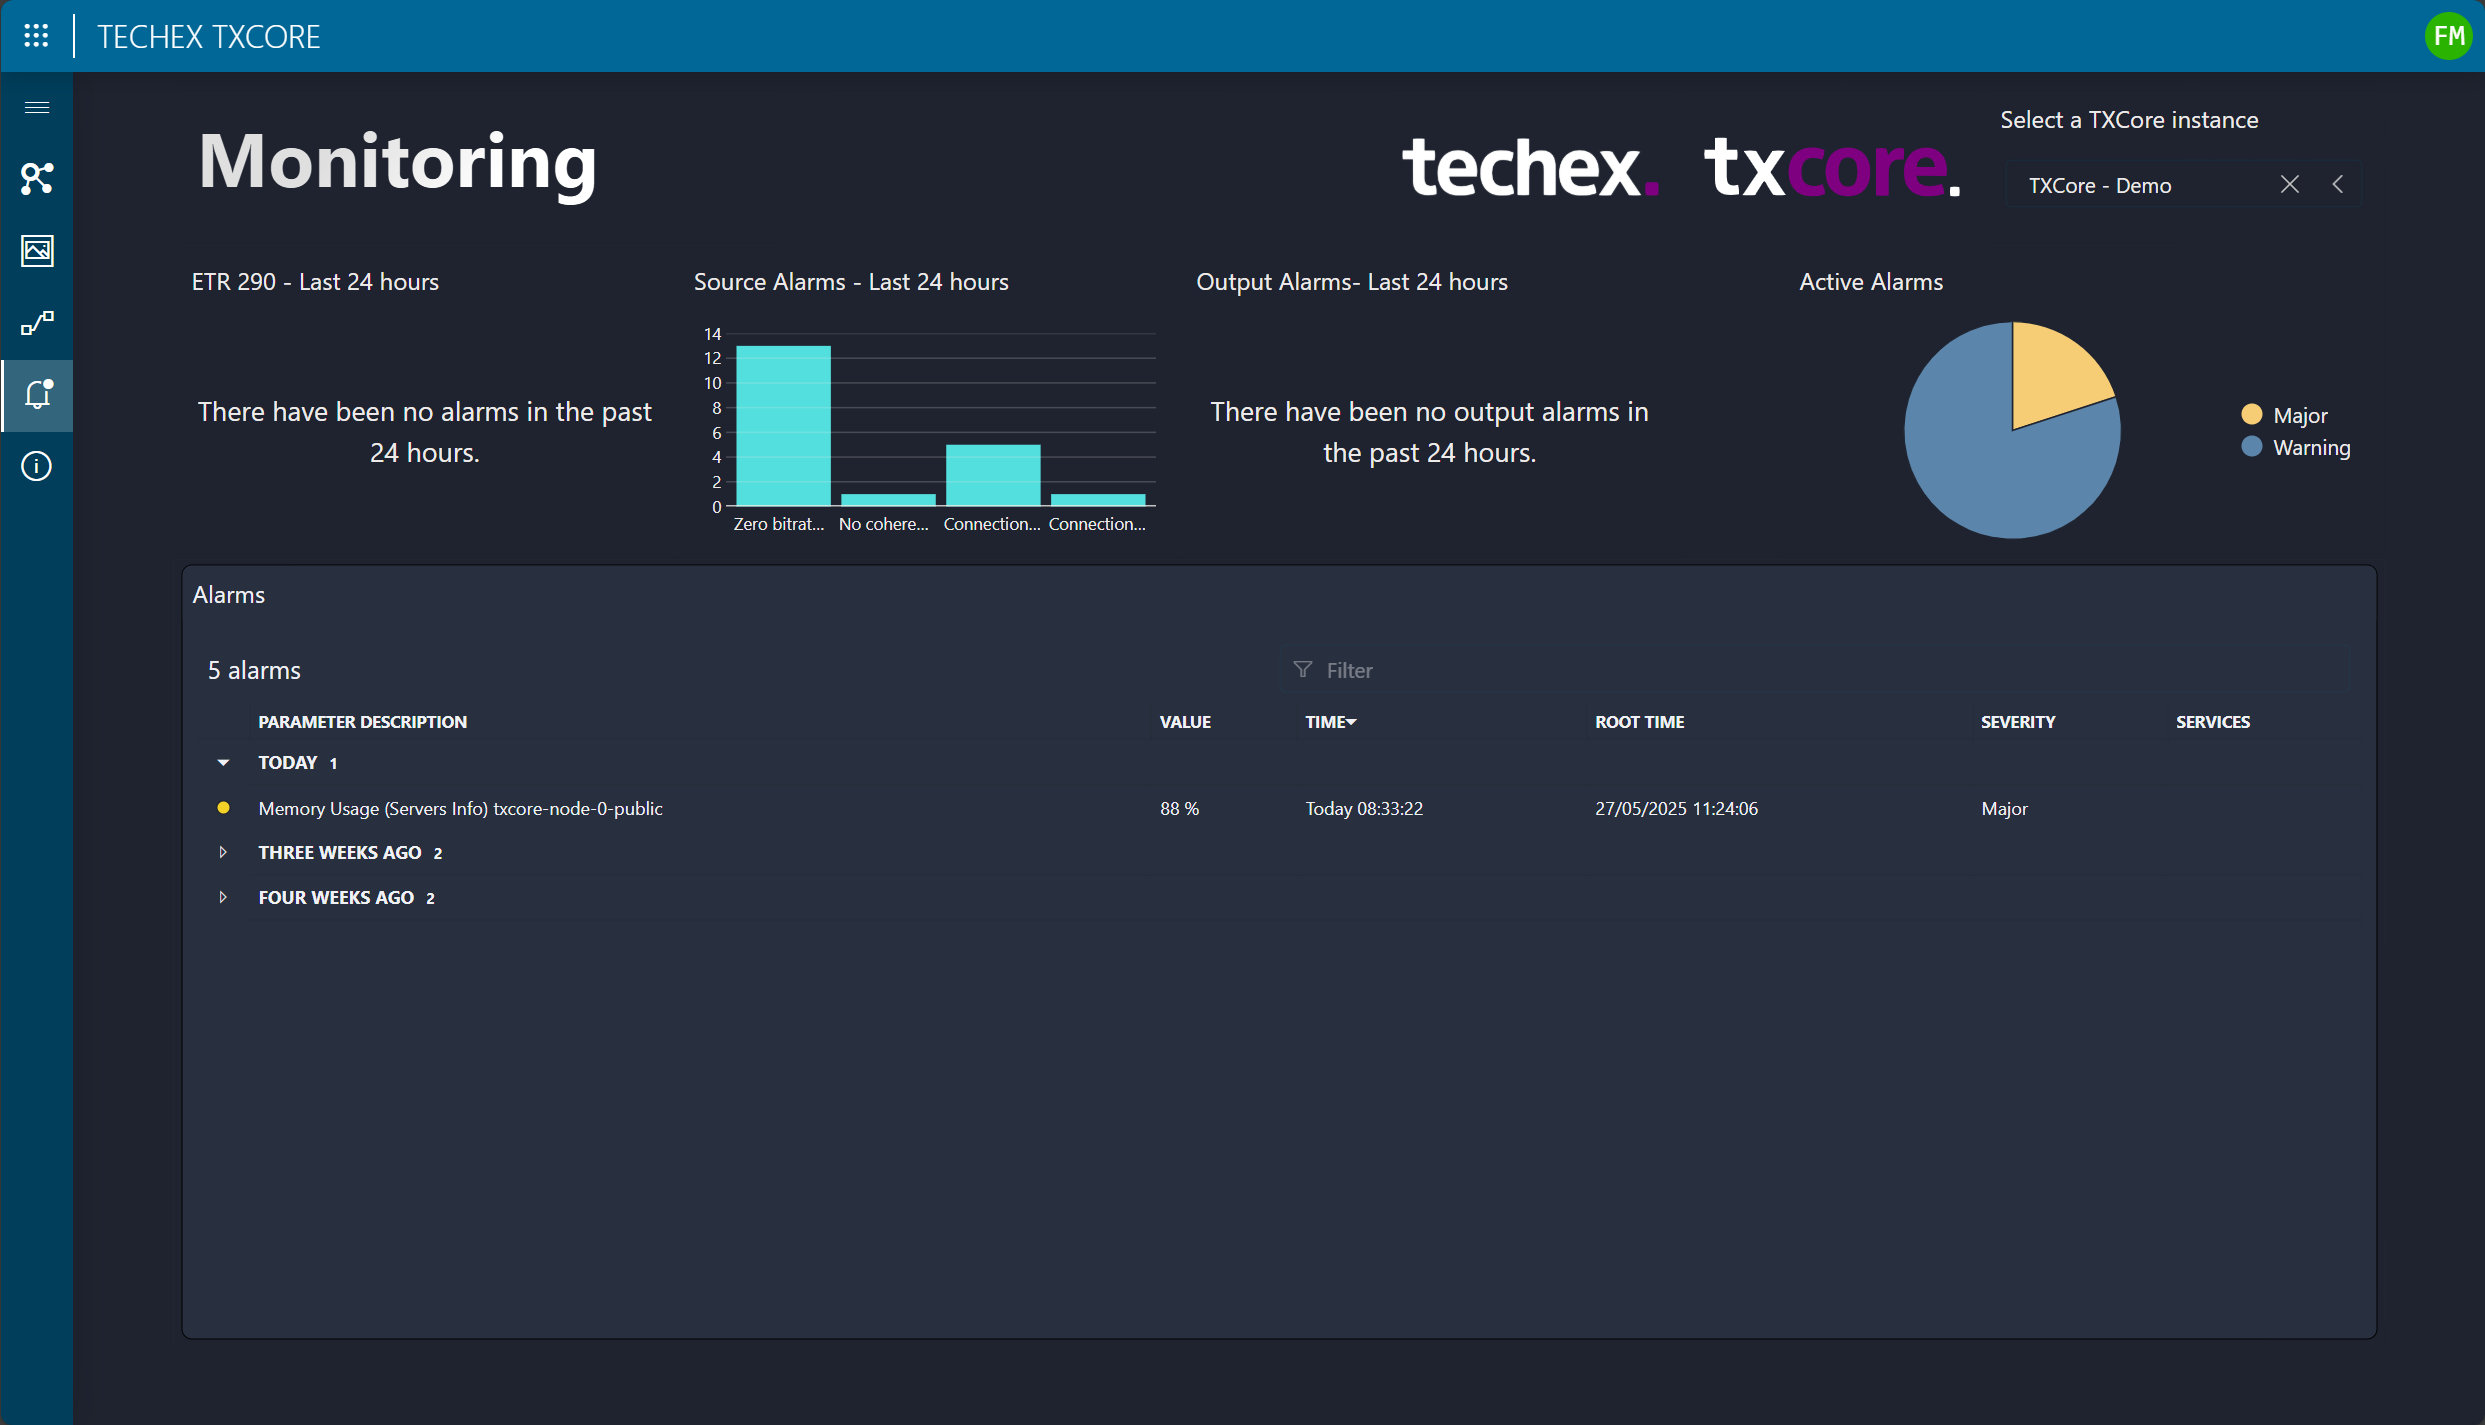
Monitoring
The Monitoring page provides a comprehensive overview of all existing alarms, including those from the past 24 hours for ETR290, sources, and outputs.