IP Network Explorer UI overview
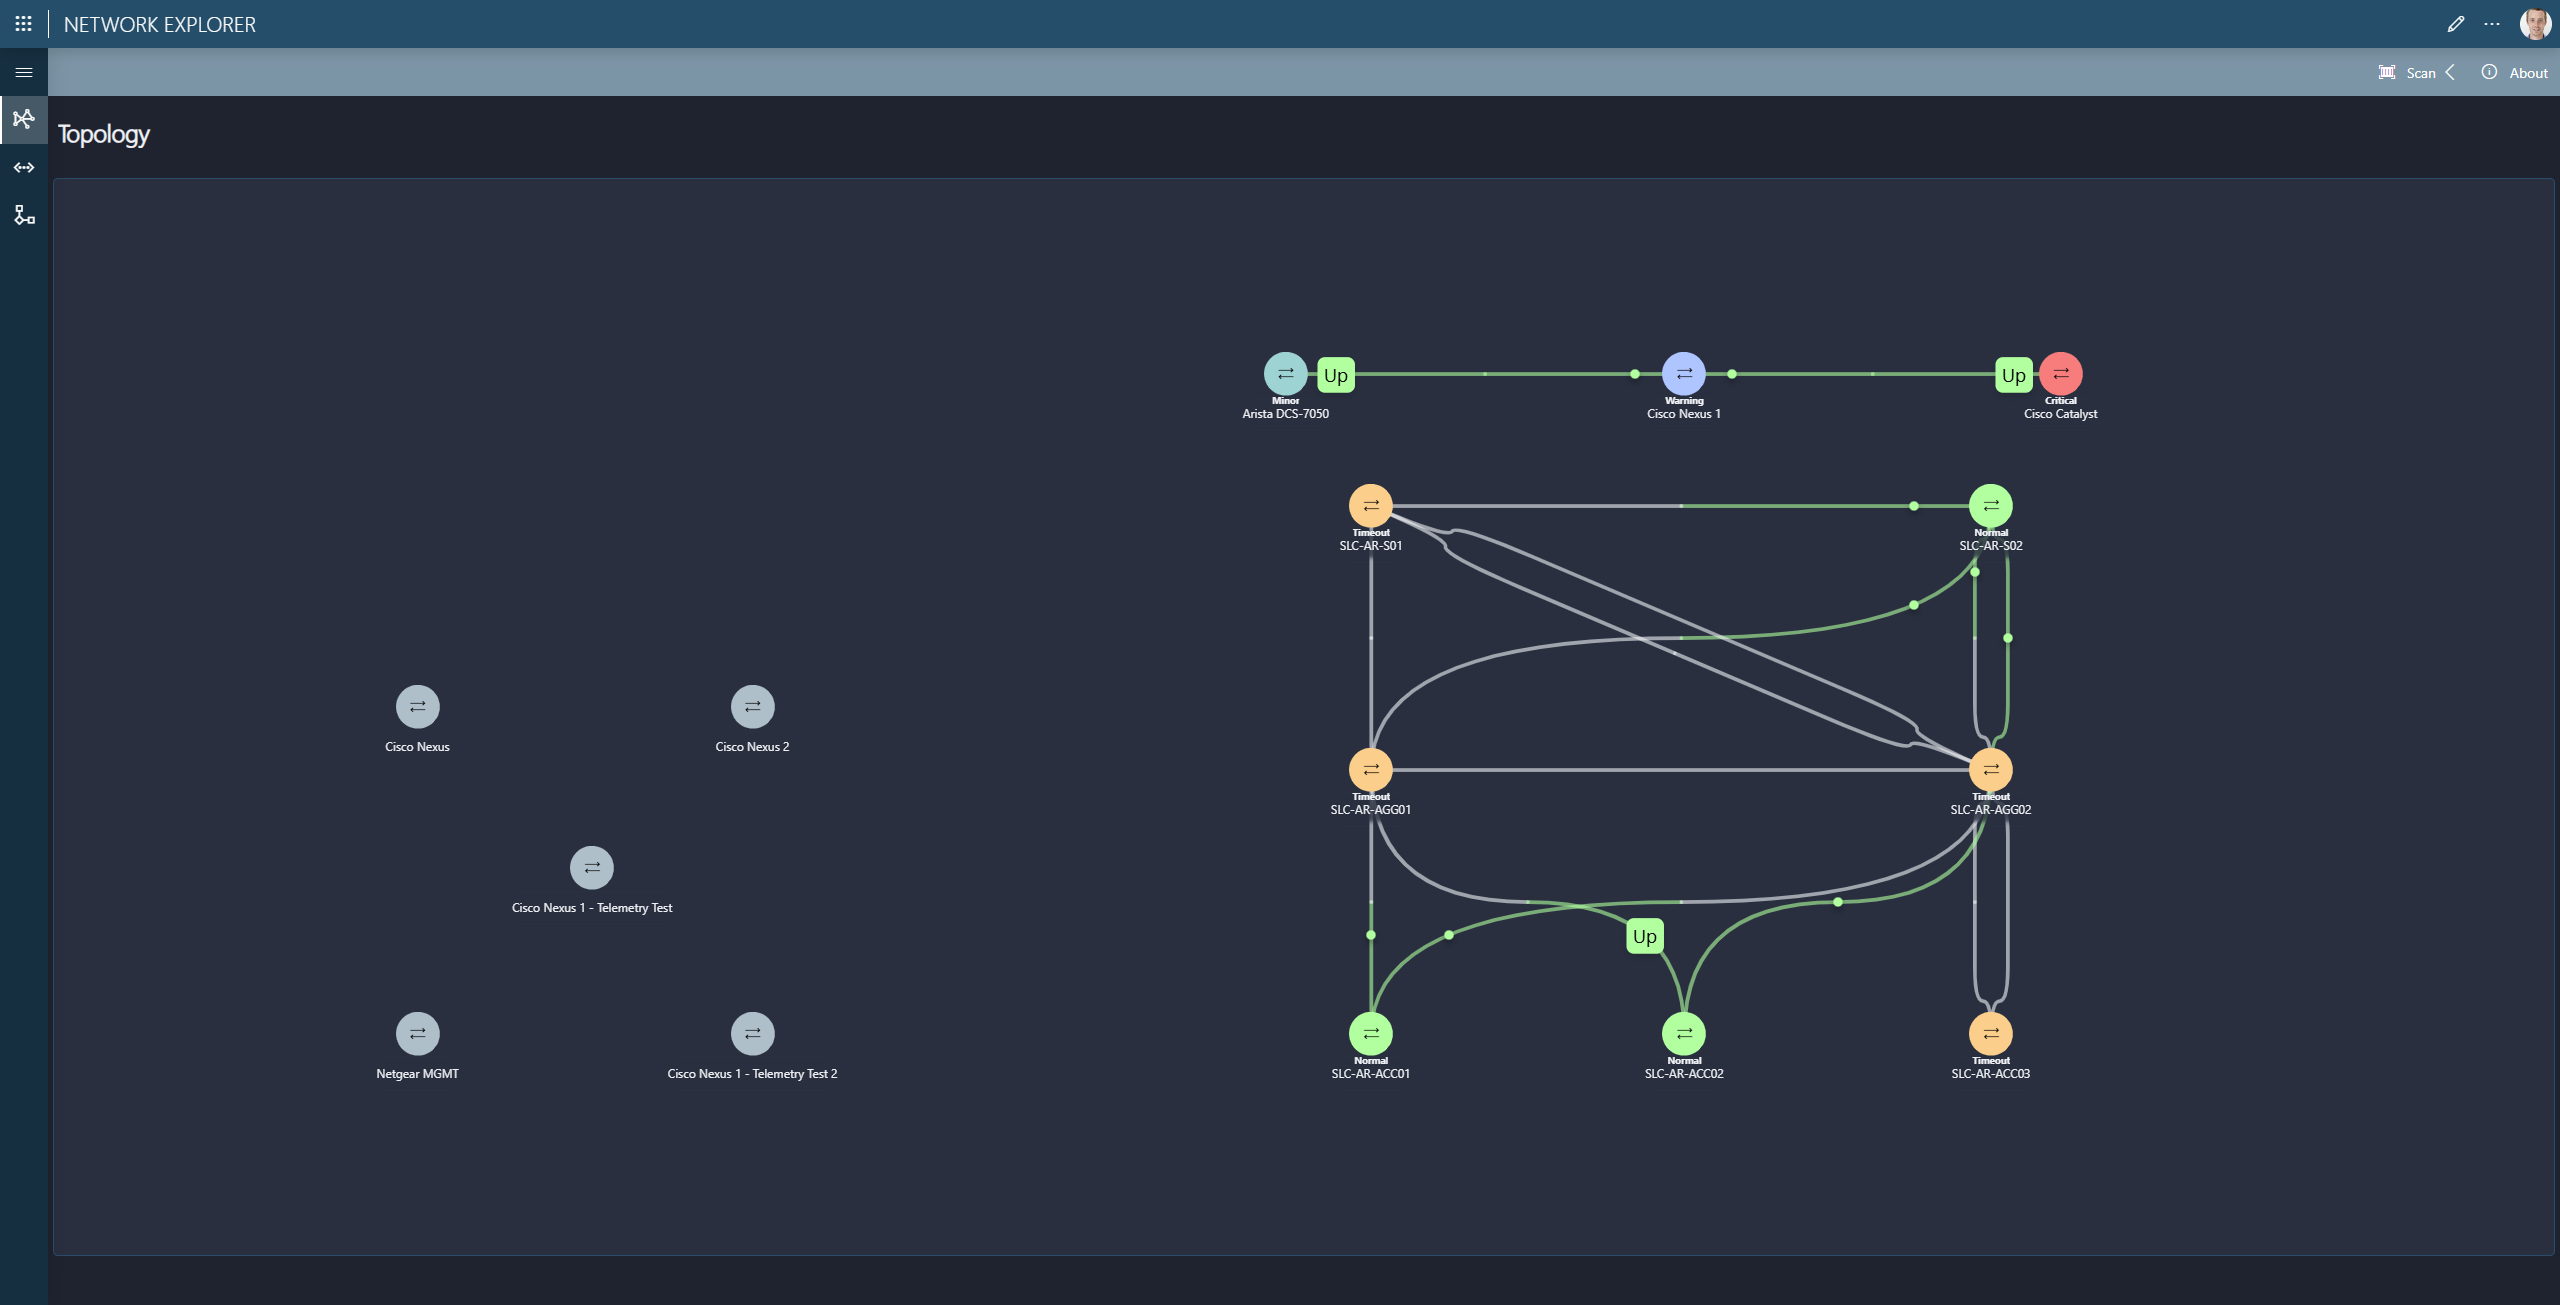
Topology
The Topology page provides an overview of your network's status, based on real-time alarm data from your DataMiner System.
Both network devices and connections are color-coded to reflect their status.
Click any device or connection to view more details.
Topology selection
A topology selector is available in the middle of the header bar. Use this dropdown to choose which topology to display.
Topologies make it possible to:
- Visualize the same network segments in different ways.
- Focus on specific parts of the network.
- Create clearer overviews for different operational needs.
- Separate logical, geographical, or functional network structures.
When a topology is selected, the view updates immediately to reflect the chosen configuration.
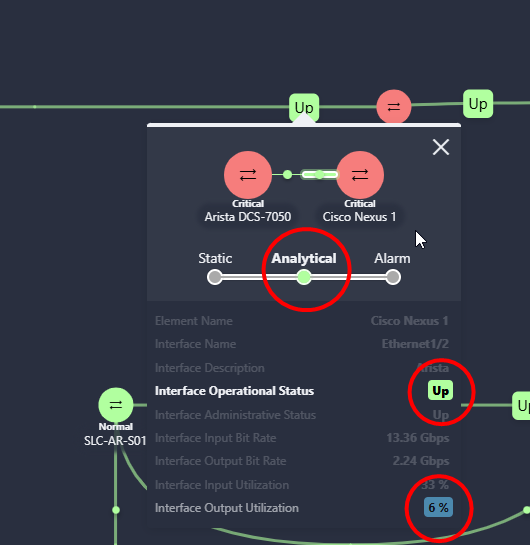
Metric selection
When hovering over a connection, you can use the dot in the upper-right corner of the details window to choose which metric is displayed and used to color the lines.
You can select either interface operational status or interface output utilization.
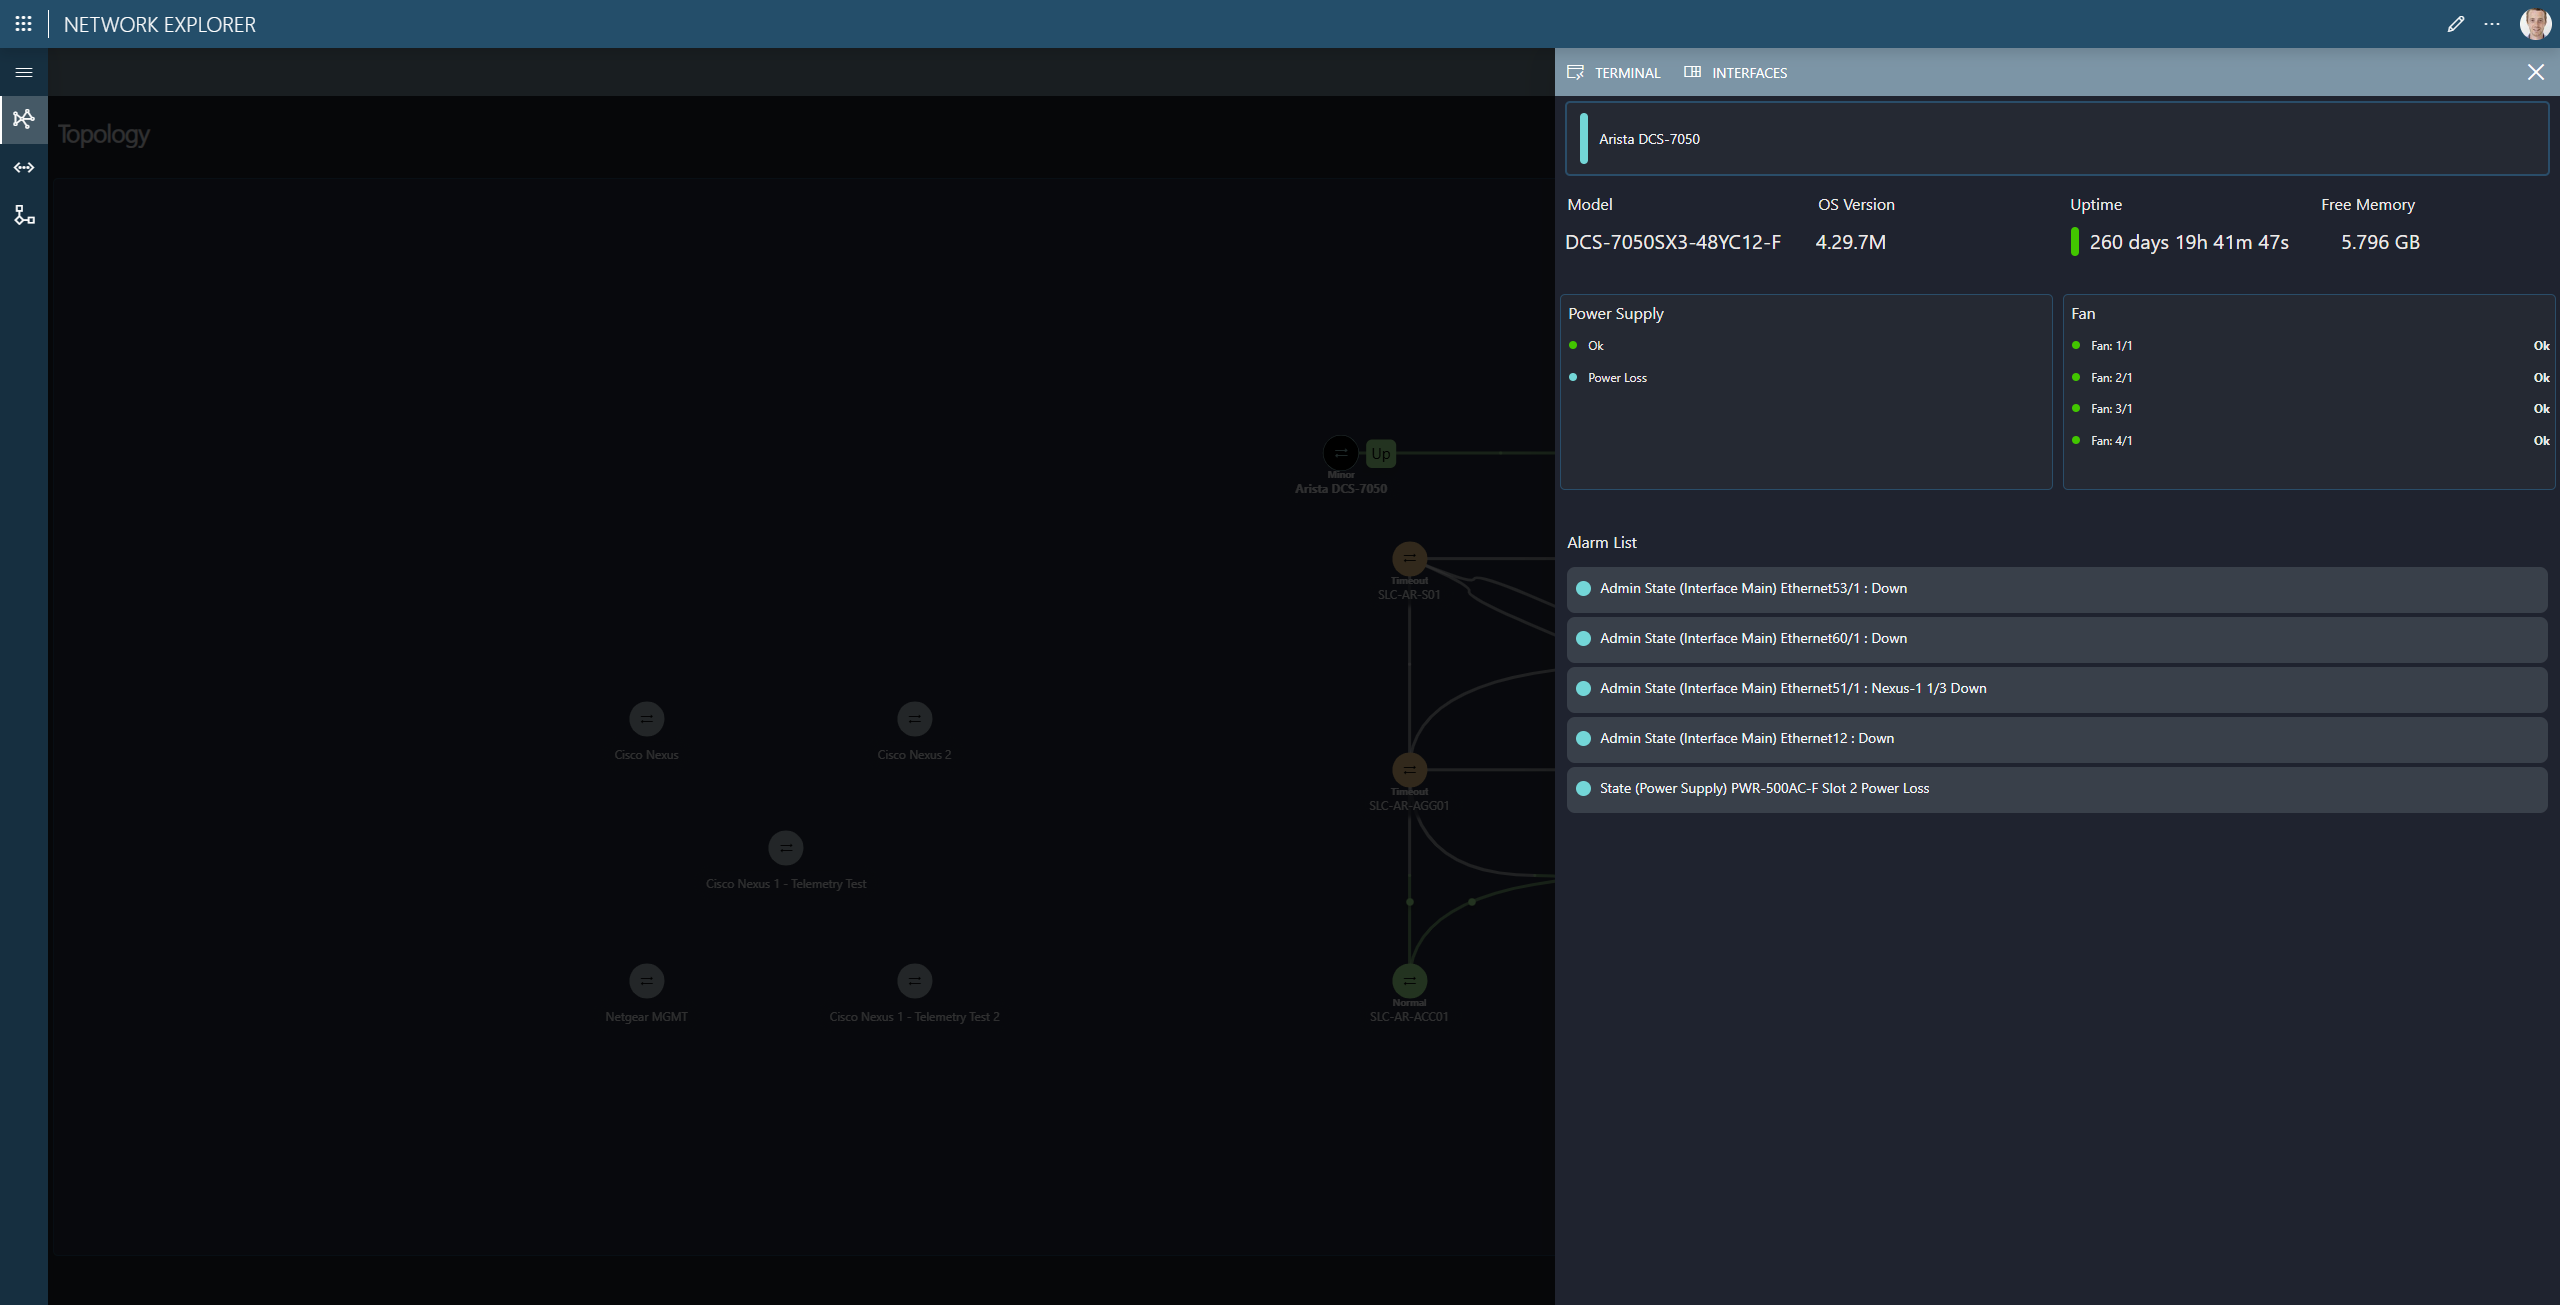
Device Details
The Device Details pane gives an overview of the device's overall health.
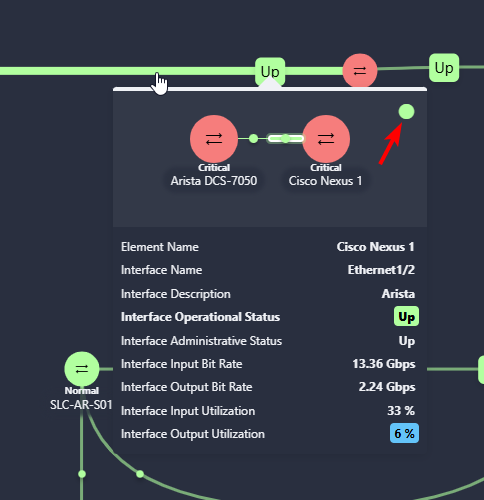
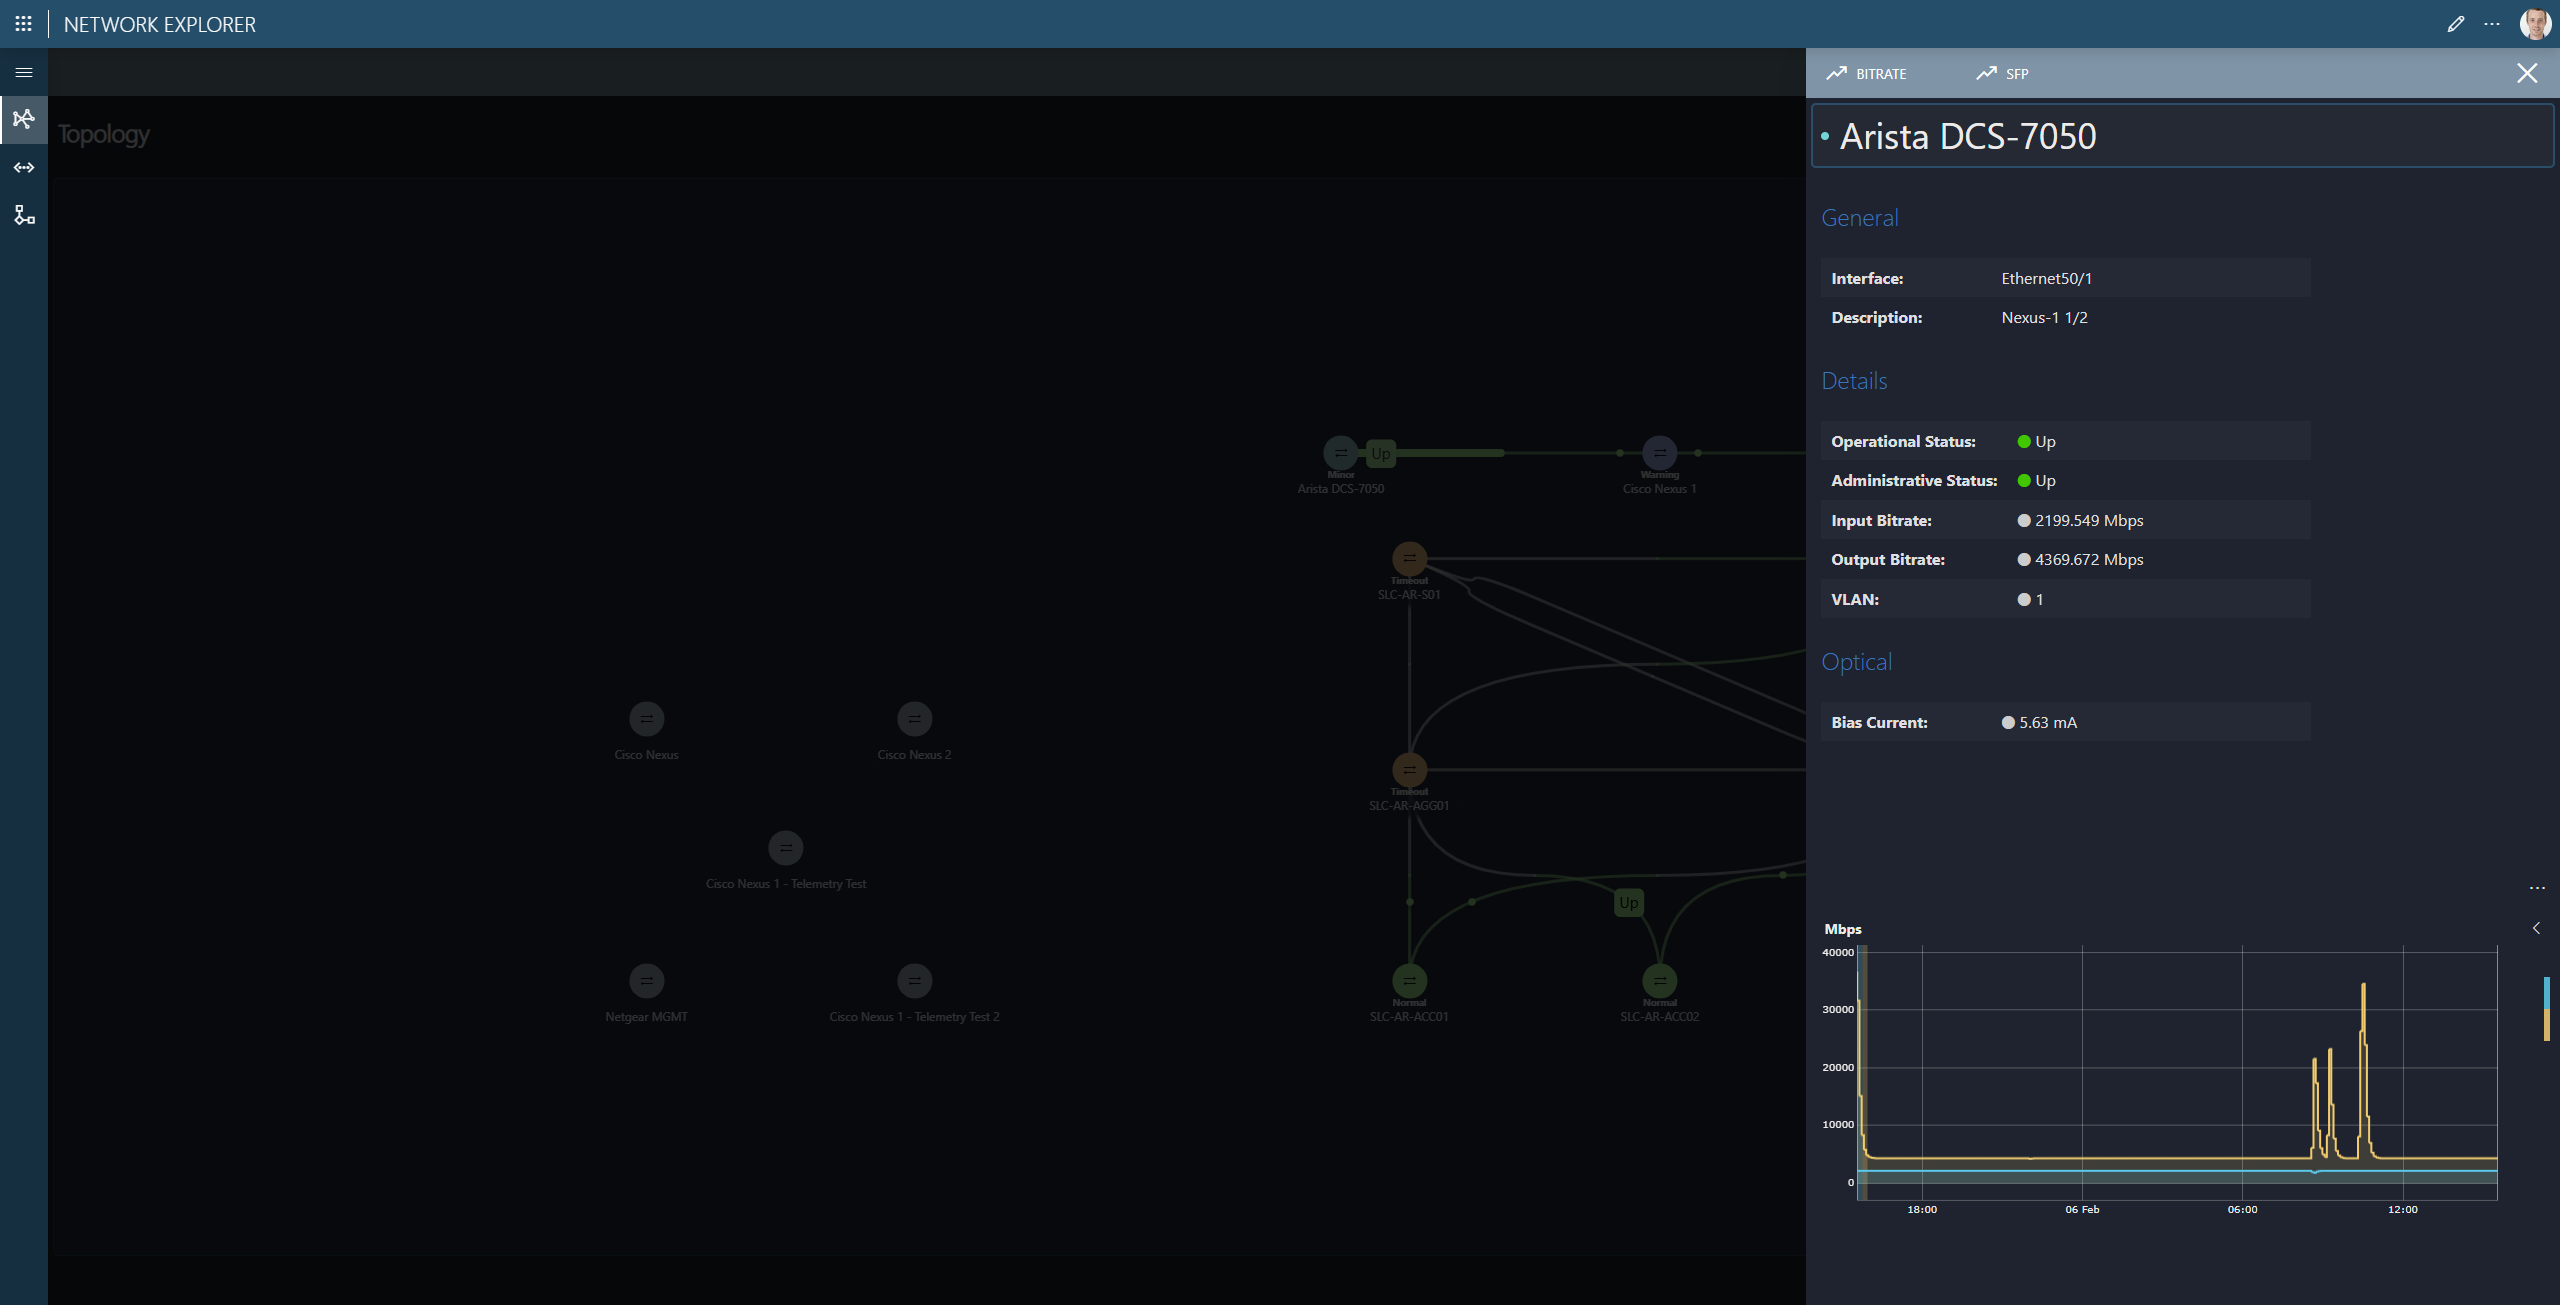
Connection Details
The Connection Details pane provides detailed insights into a connection.
The Bitrate and SFP buttons at the top allow you to access interactive trend graphs.
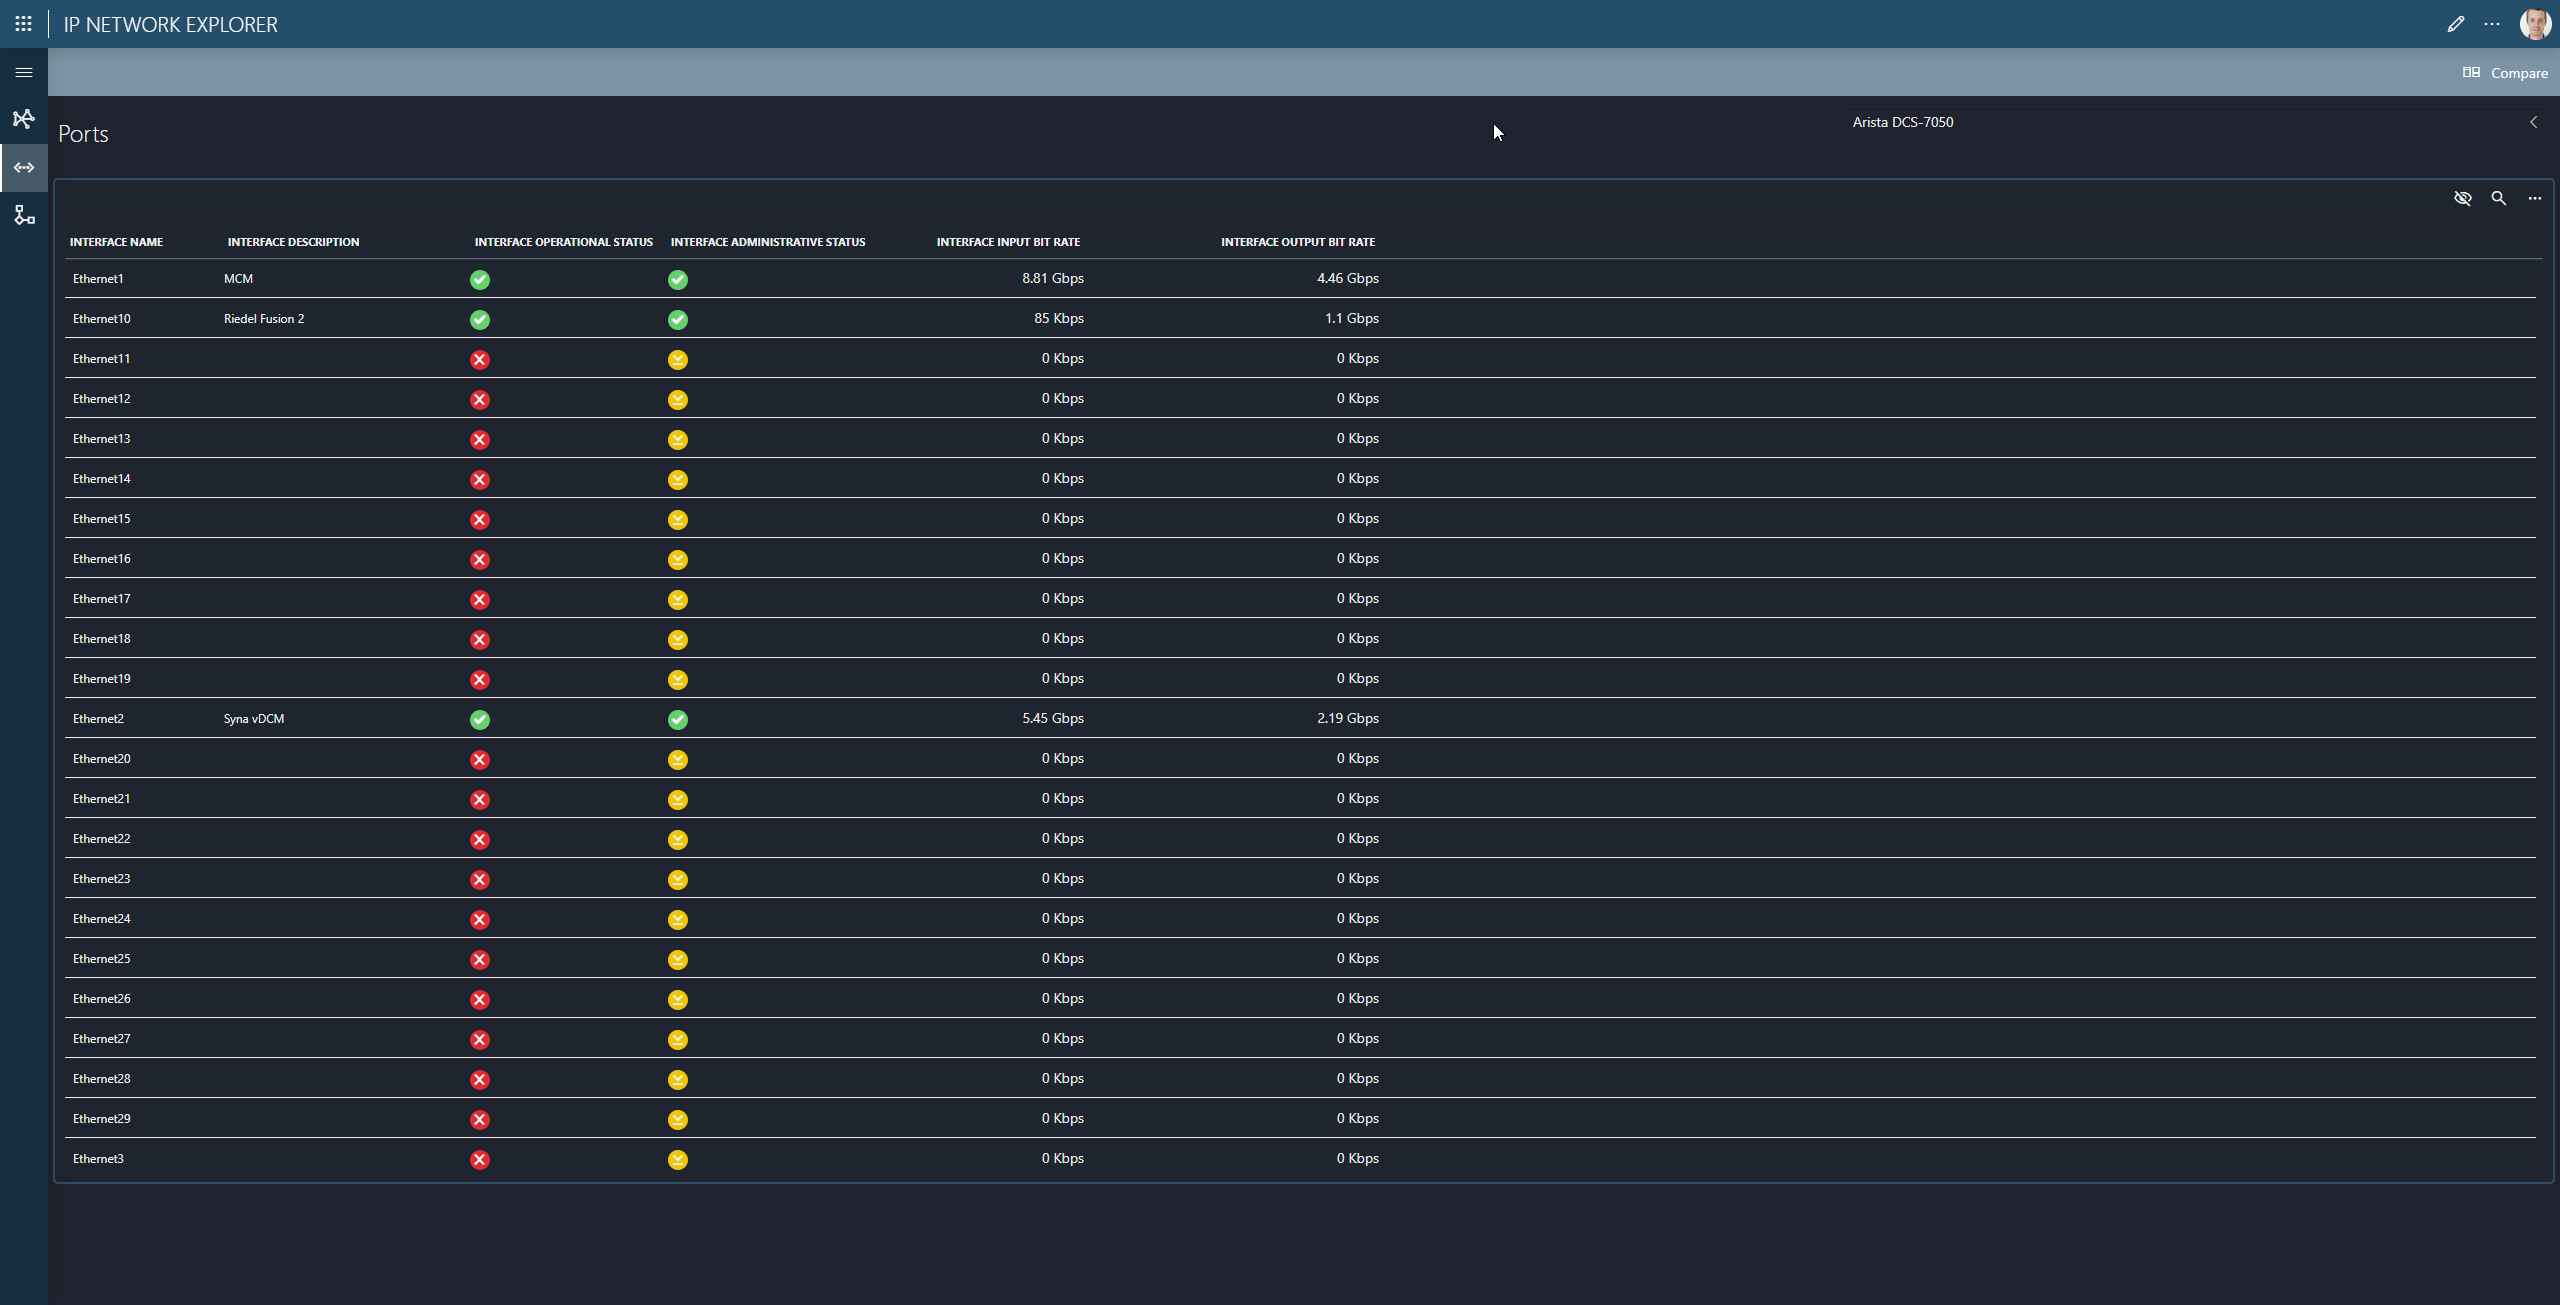
Ports
The Ports page shows an overview of all ports for the selected network device.
To switch devices, use the dropdown box in the upper-right corner.
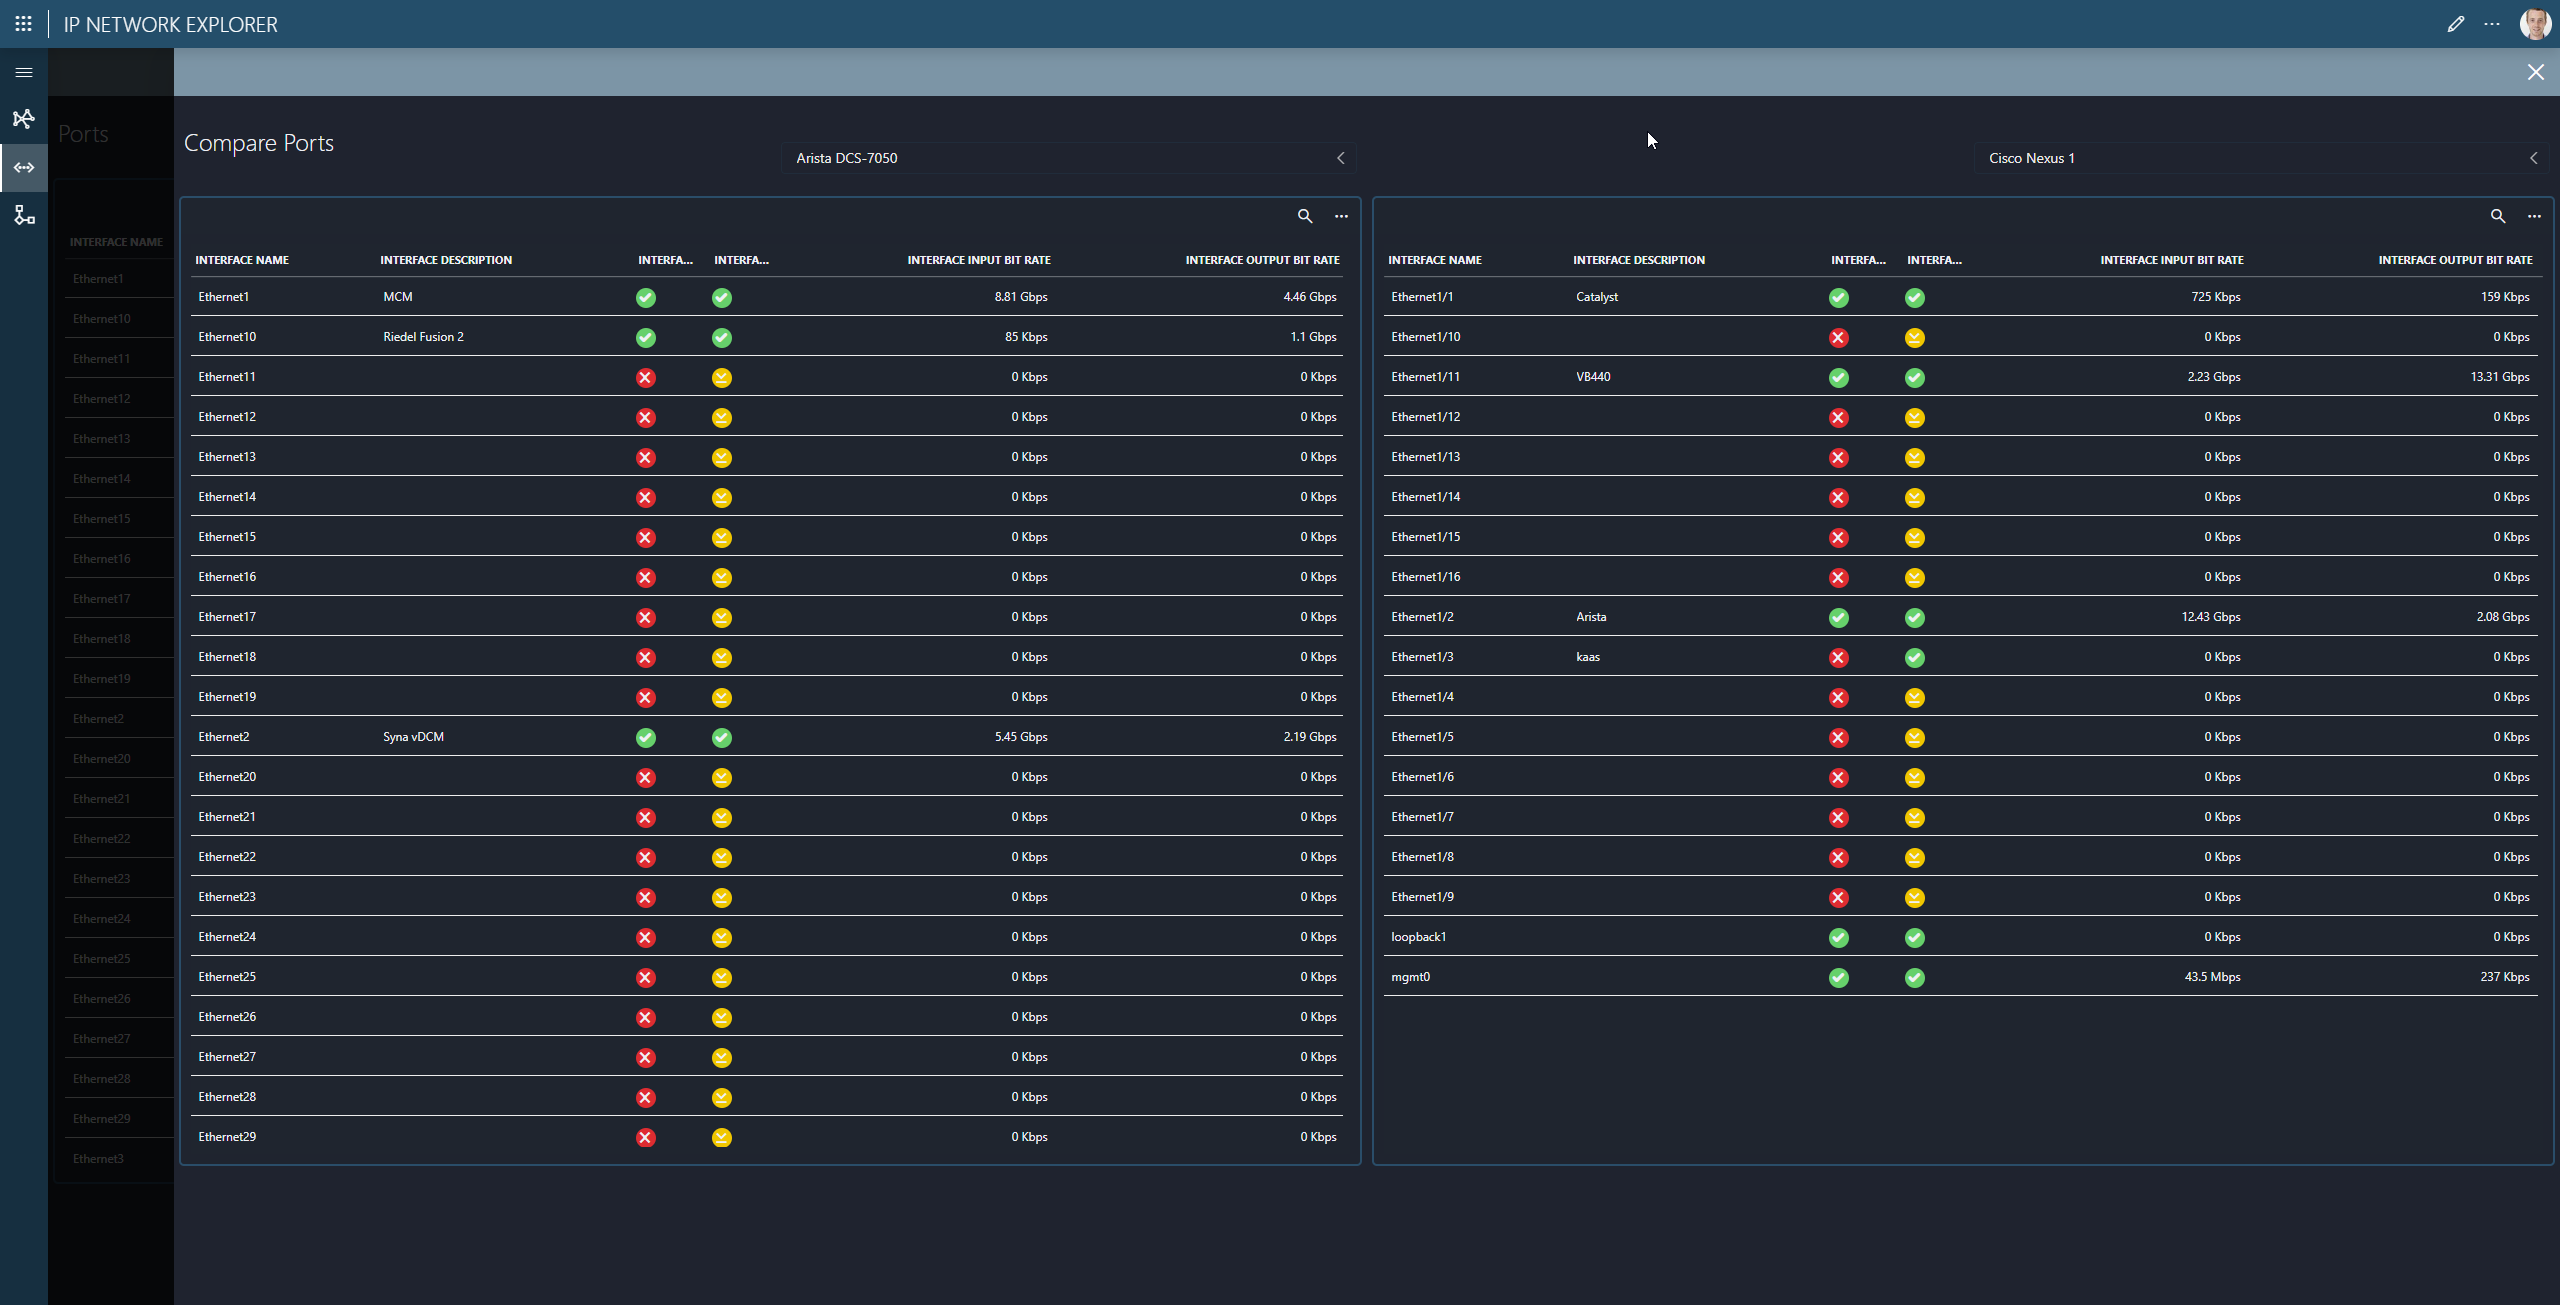
With the Compare button in the header bar, you can view the ports of two devices side by side for easier analysis.
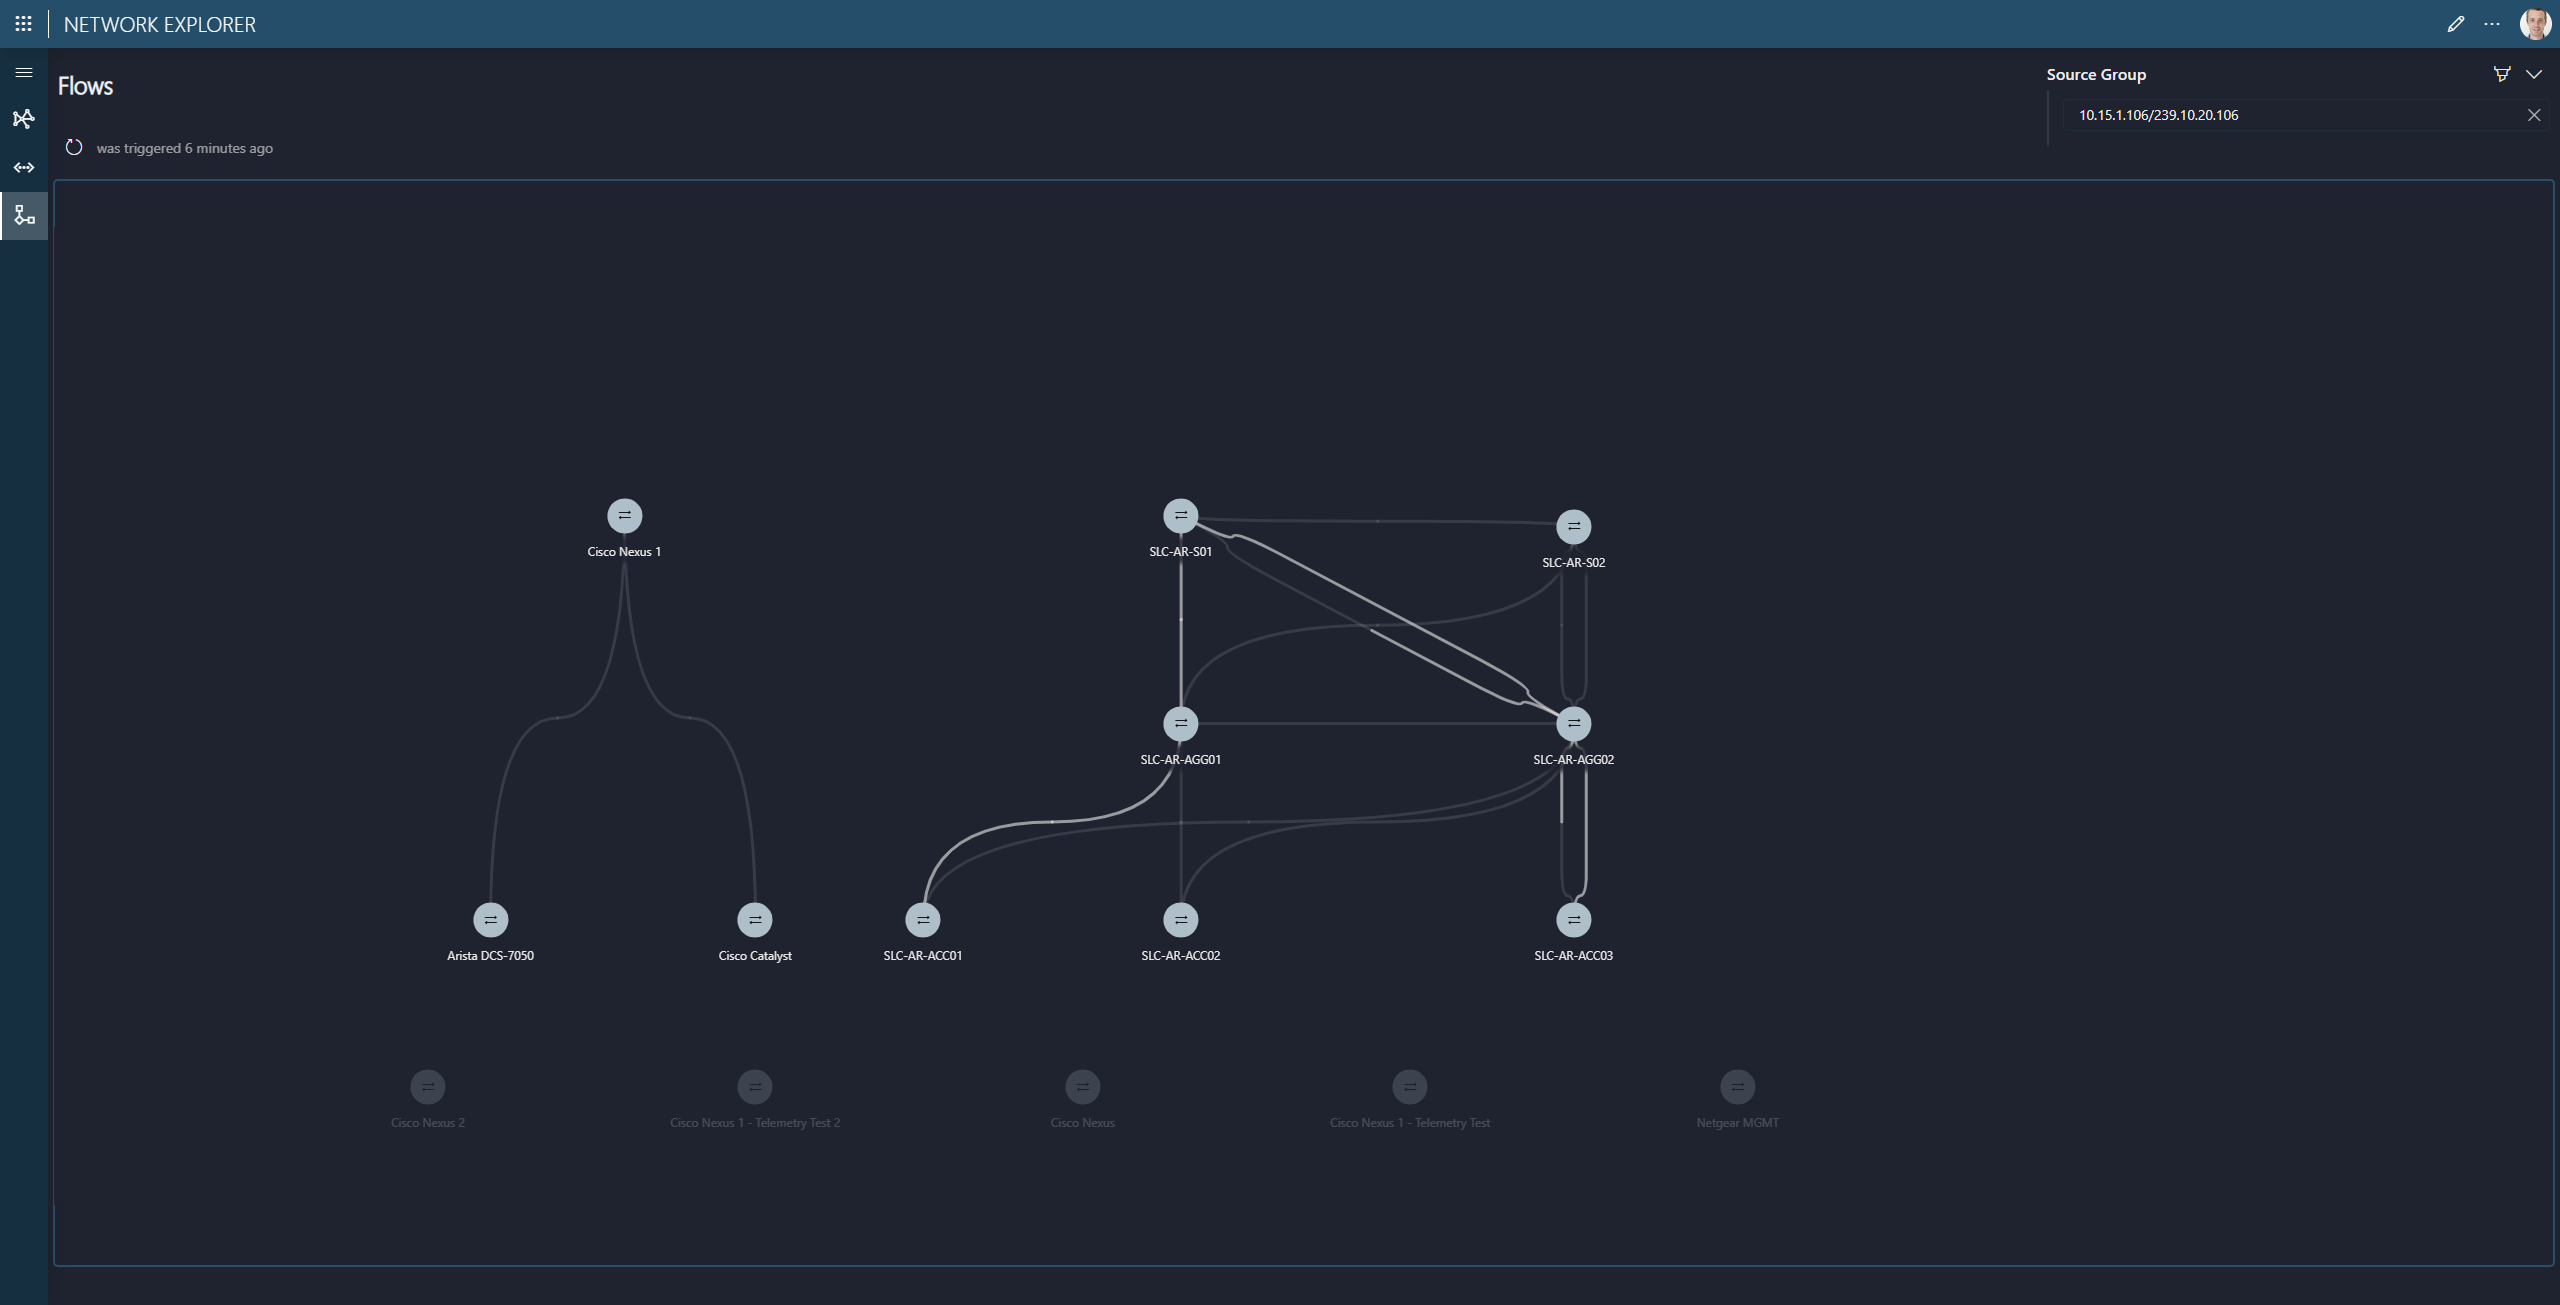
Flows
The Flows page is similar to the Topology page but is specifically used to track multicast traffic in the network.
Use the filter box on the left side of the page to find a multicast flow.
You can filter by:
- Source IP address
- Multicast IP address
- Both, using the format
source-ip/multicast-ip. For example:10.14.1.104/239.10.20.106.
Application settings
To open the application settings, click the cogwheel button at the bottom of the sidebar on the left.
In the application settings window, you can manage the different topologies, update the default IP scan range and adjust the automatic removal behavior for removed connections. To access the application settings, click the About button in the upper-right corner and then click the Settings button at the top of window.
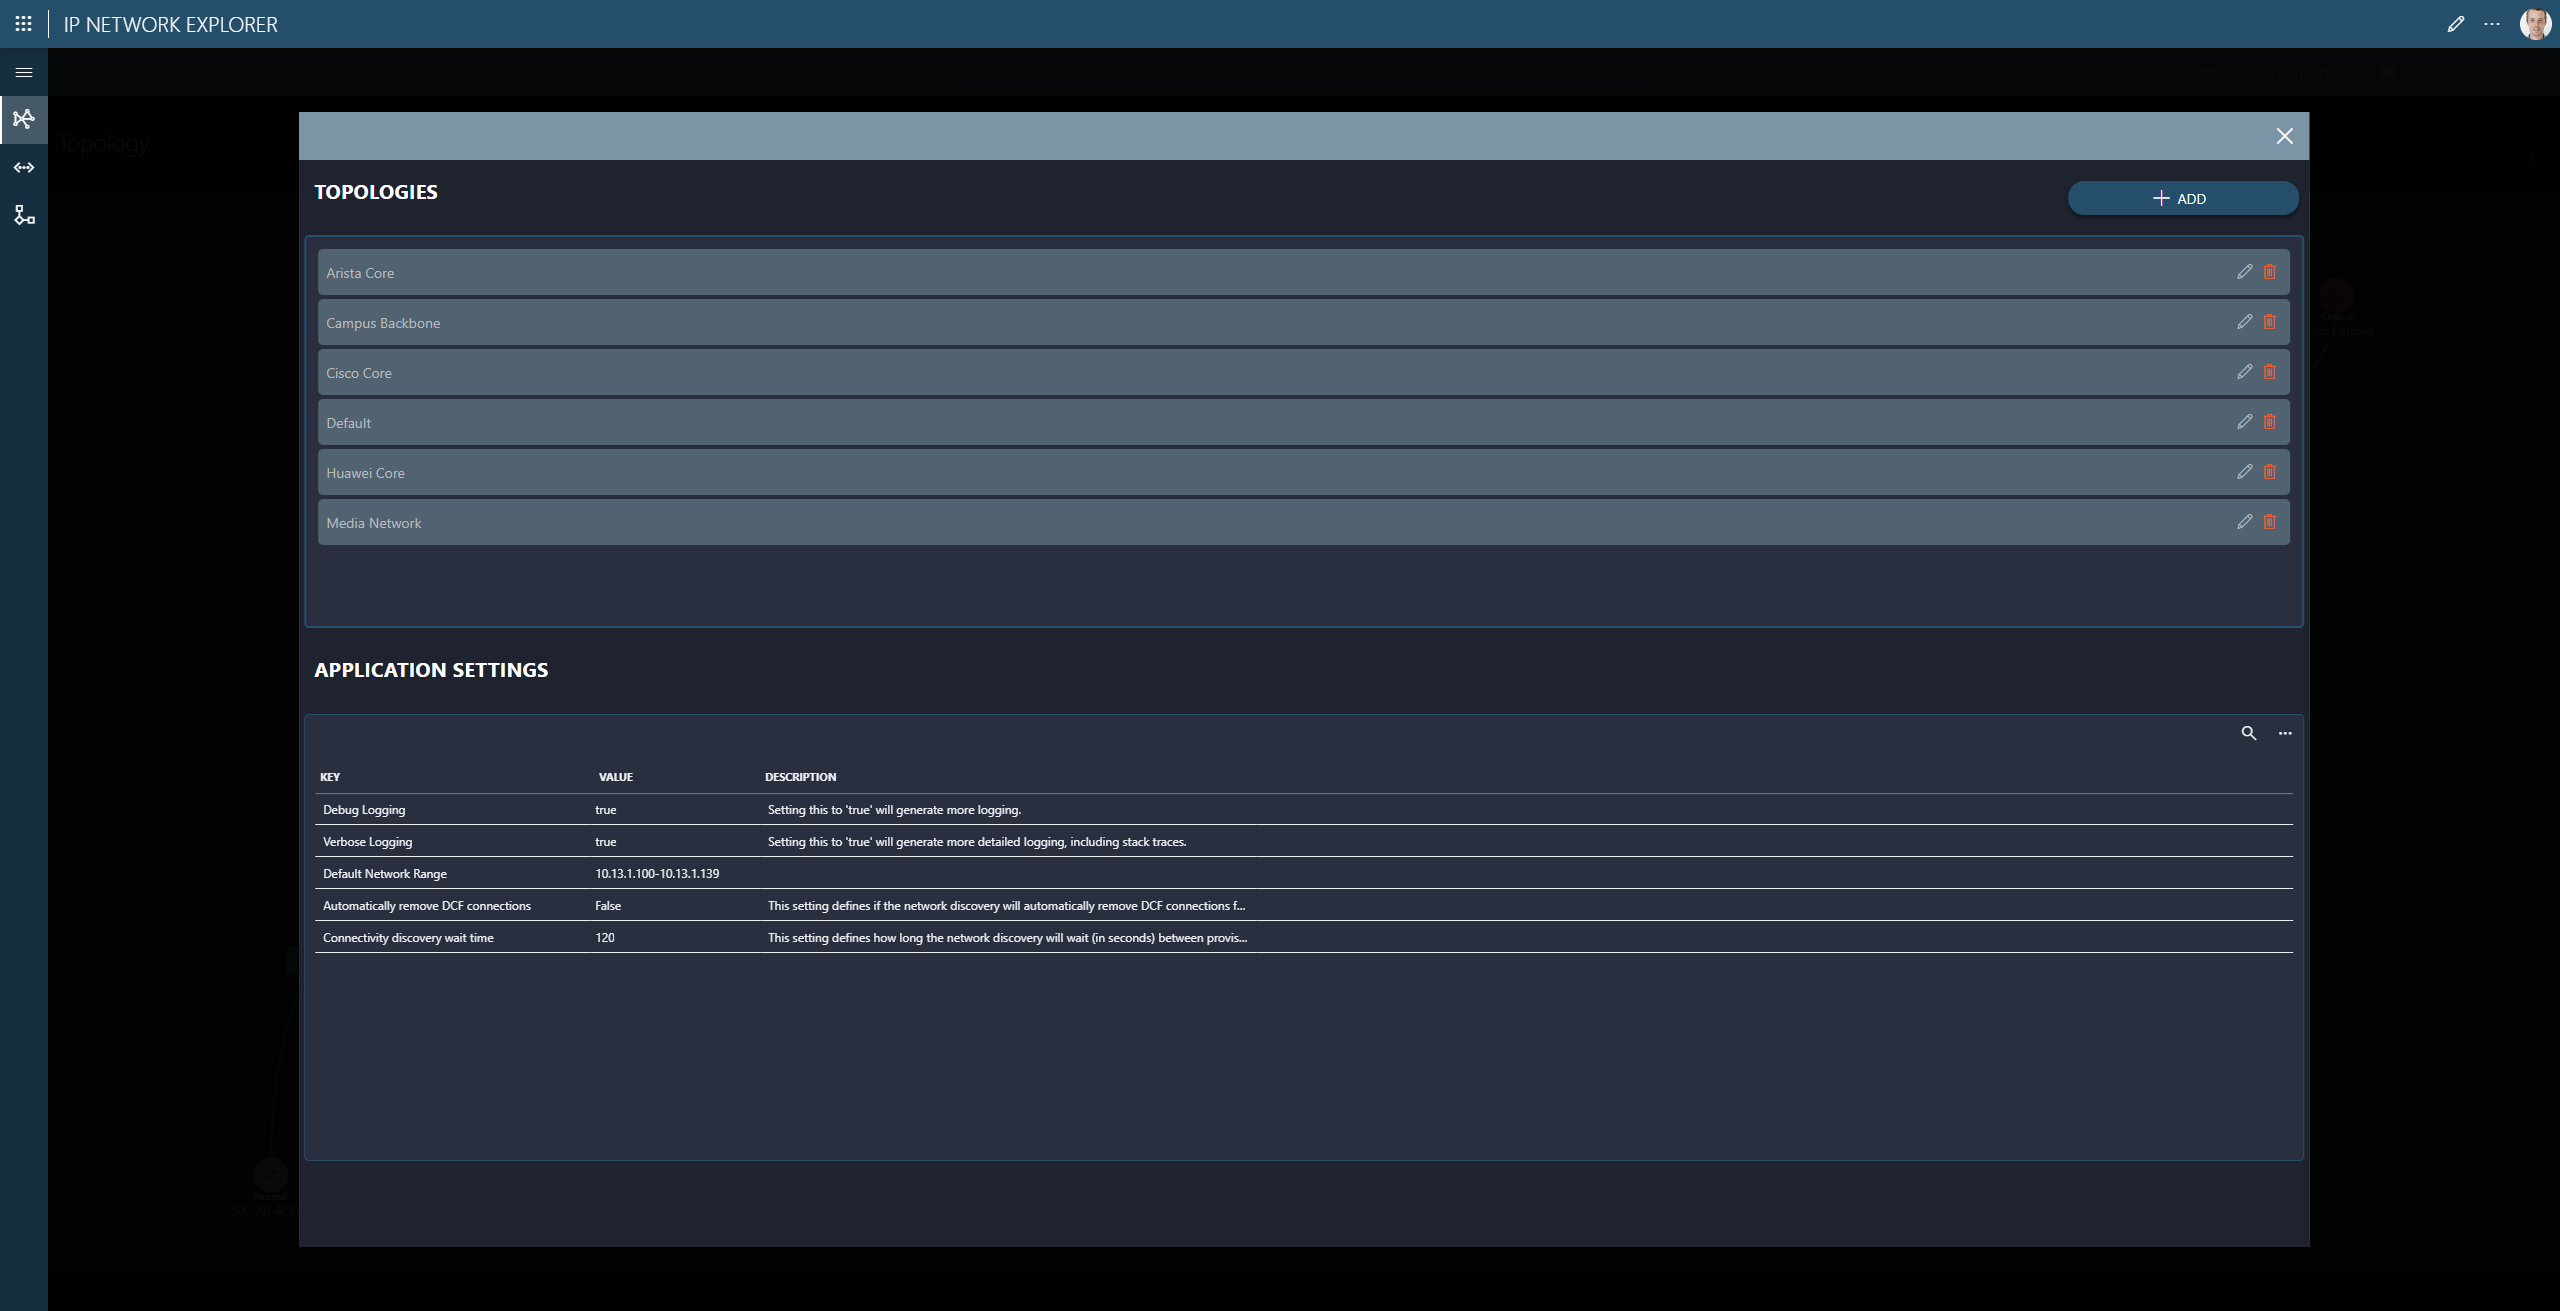
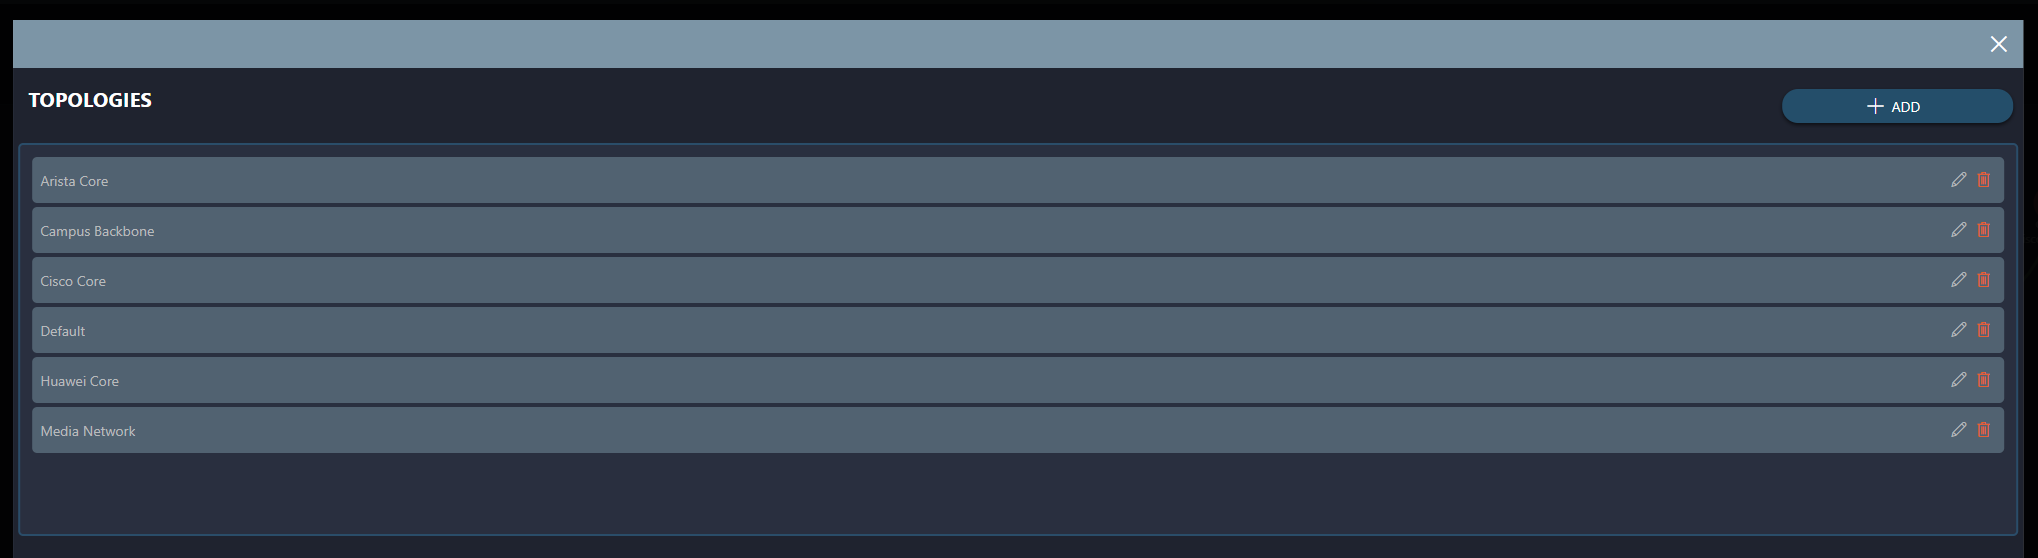
Topology settings
With the ADD button in the upper-right corner of the application settings window, you can create a new topology.
In the overview list of the topologies, you can use the pencil icon to edit an existing topology or the garbage can icon to delete a topology.
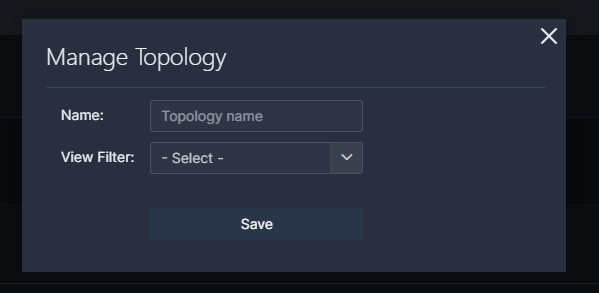
Creating a topology
When you have clicked the ADD button in the application settings window, you will need to specify the following information to create a new topology:
Name: Each topology must have a unique name. This name will be shown in the topology selection dropdown.
View filter: You must select a view. The selected view determines which network elements are displayed in the topology.
Only elements that are present in the selected view or in its subviews will be included in the topology. This allows you to create filtered and purpose-driven network visualizations based on your existing view structure.
Changes take effect immediately after you click Save and will be reflected in the topology selector.