The PTP low-code app
From PTP version 1.2.0 onwards, a DataMiner low-code app is available with the following pages:
The Summary page
This page shows a list of configured PTP domains and a summary of the selected domain. The first domain is selected by default.
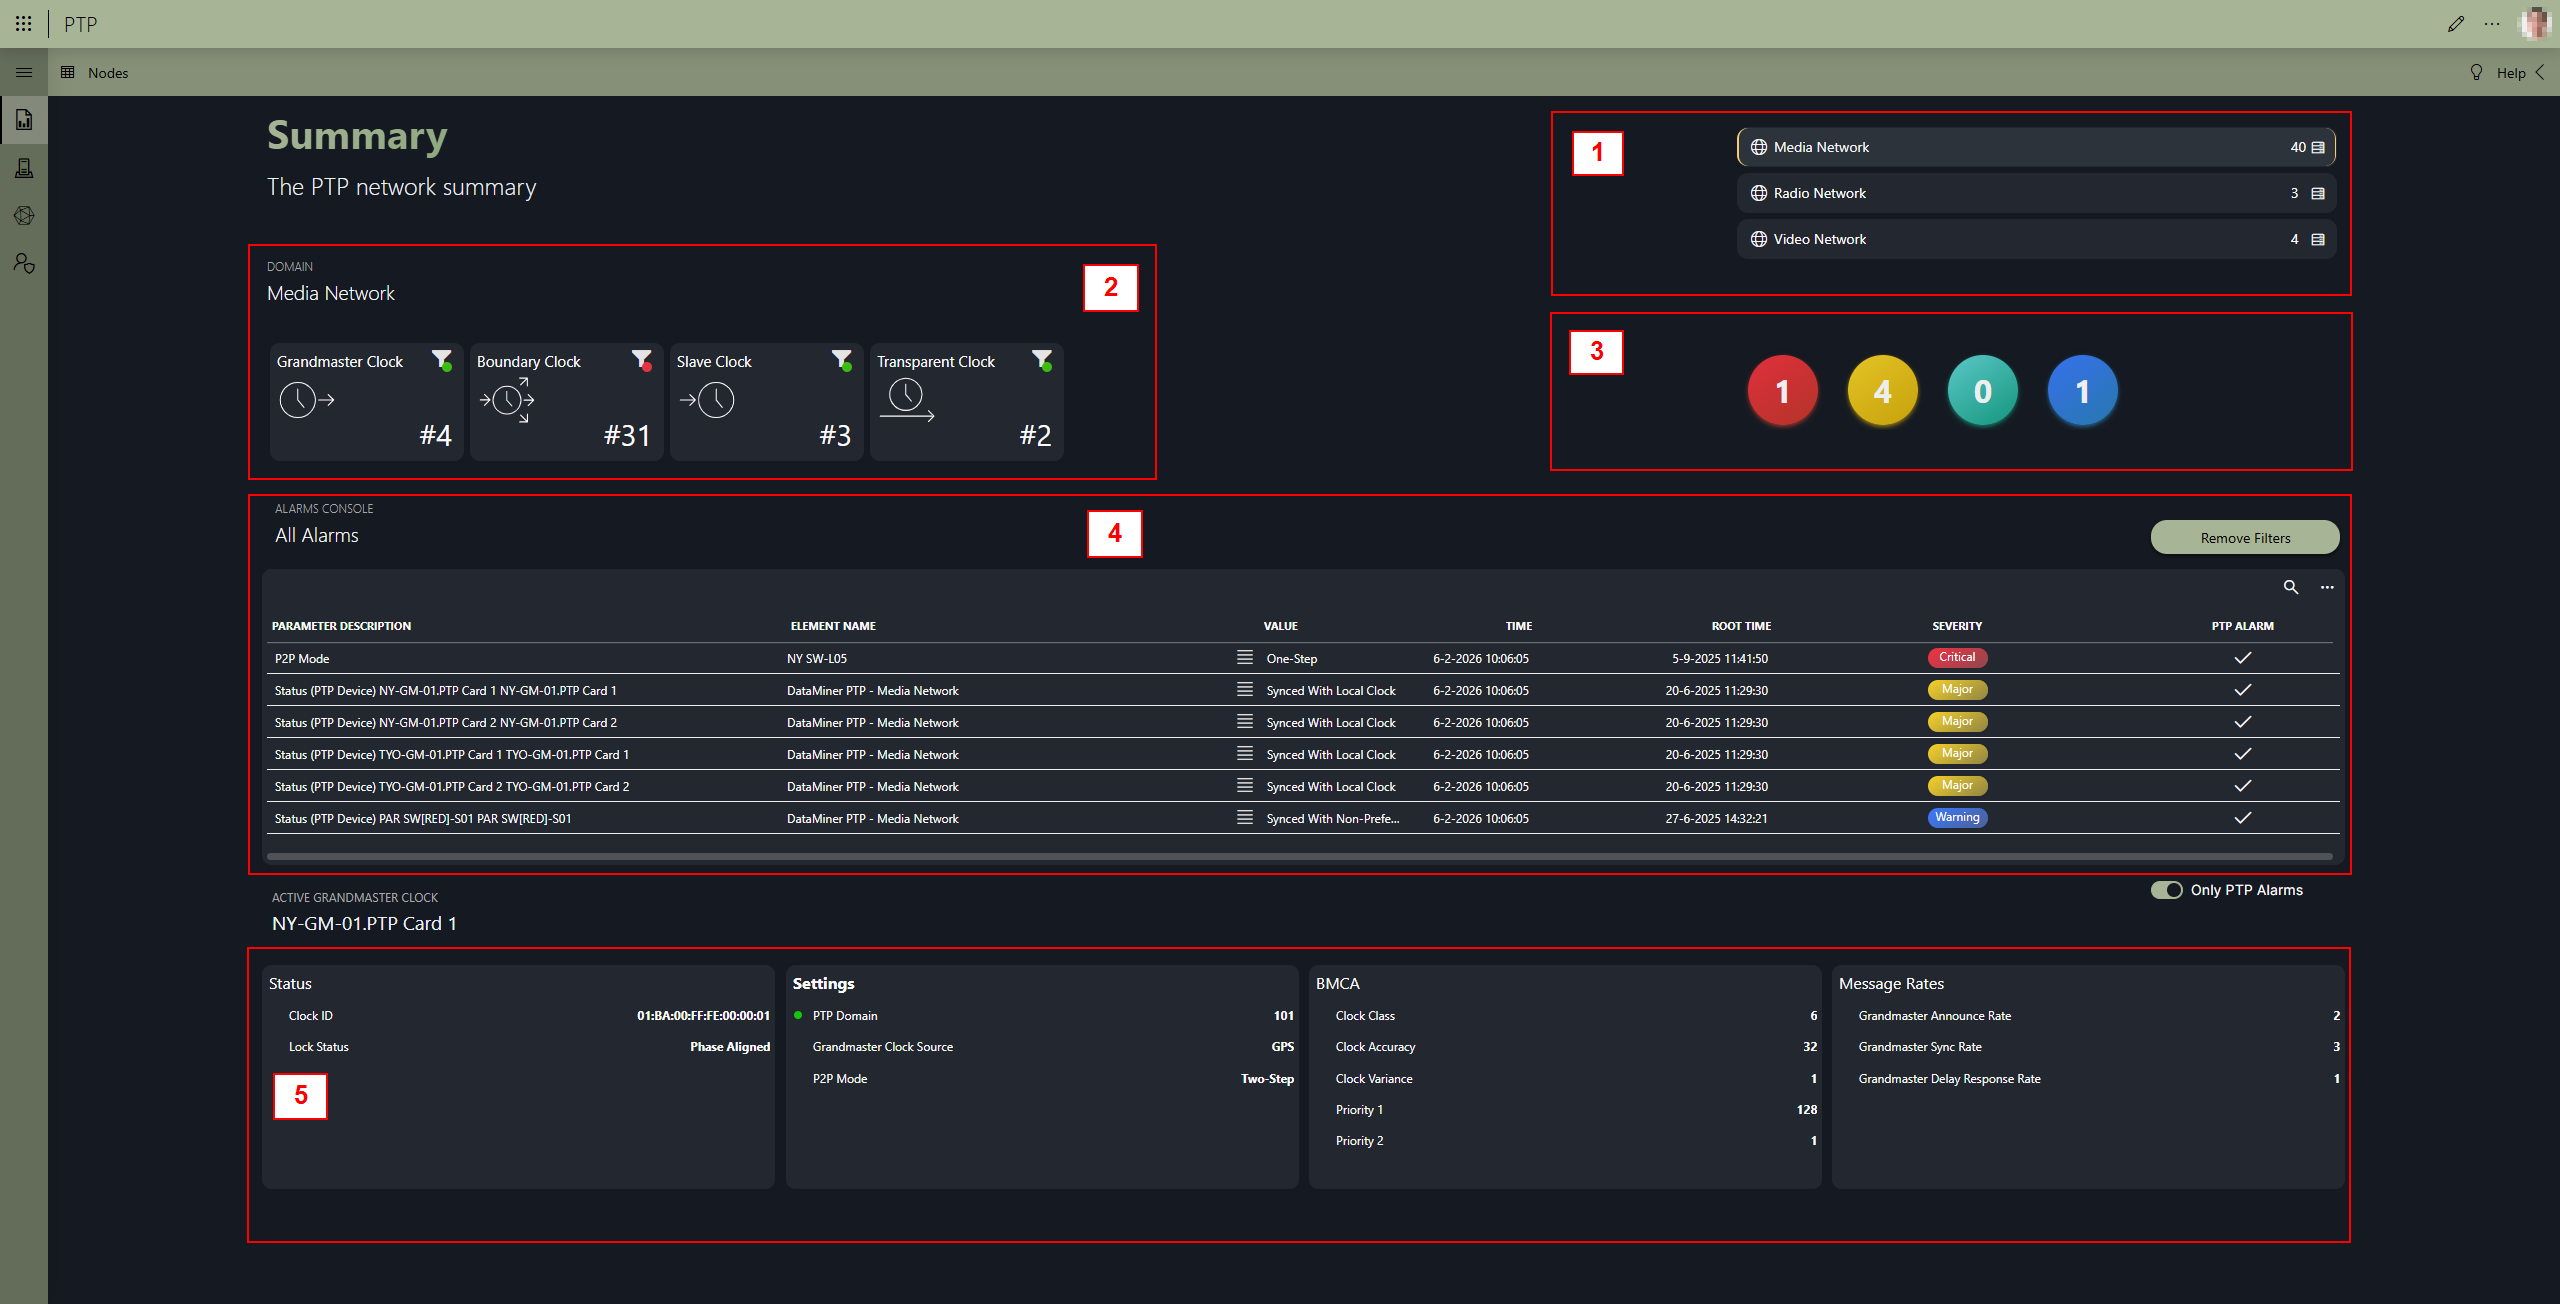
In the upper-right corner (1), you can see the configured PTP domains in the PTP Solution with the number of configured clocks per domain. The selected domain is highlighted. All the other data shown in the app will be related to this selected domain.
On the left (2), from left to right, the page shows the total number of grandmasters, boundary clocks, transparent clocks, and slave clocks in the selected PTP domain. The filter icon in each box indicates if there are any active alarms for the respective clock type. When you click the filter icon, the alarm list below will be filtered to the specific clock type.
On the right (3), the page shows the total number of alarms in the PTP domain per severity. When you click one of the circles, the alarm list below will be filtered to the specific severity.
The alarm list (4) will show all alarms of the selected PTP domain. By default only PTP-related alarms are shown, but you can use the toggle button below the list to also show all alarms of the equipment included in the PTP domain.
In the list, a hamburger button
 is shown next to each element name. This opens a context menu that provides access to the monitoring app and a details panel for the element.
At the bottom of the page (5), general parameters of the detected active grandmaster are shown.
The Nodes page
This page lists all PTP nodes in the domain, grouped by PTP role, with icons showing the element alarm state for each node.
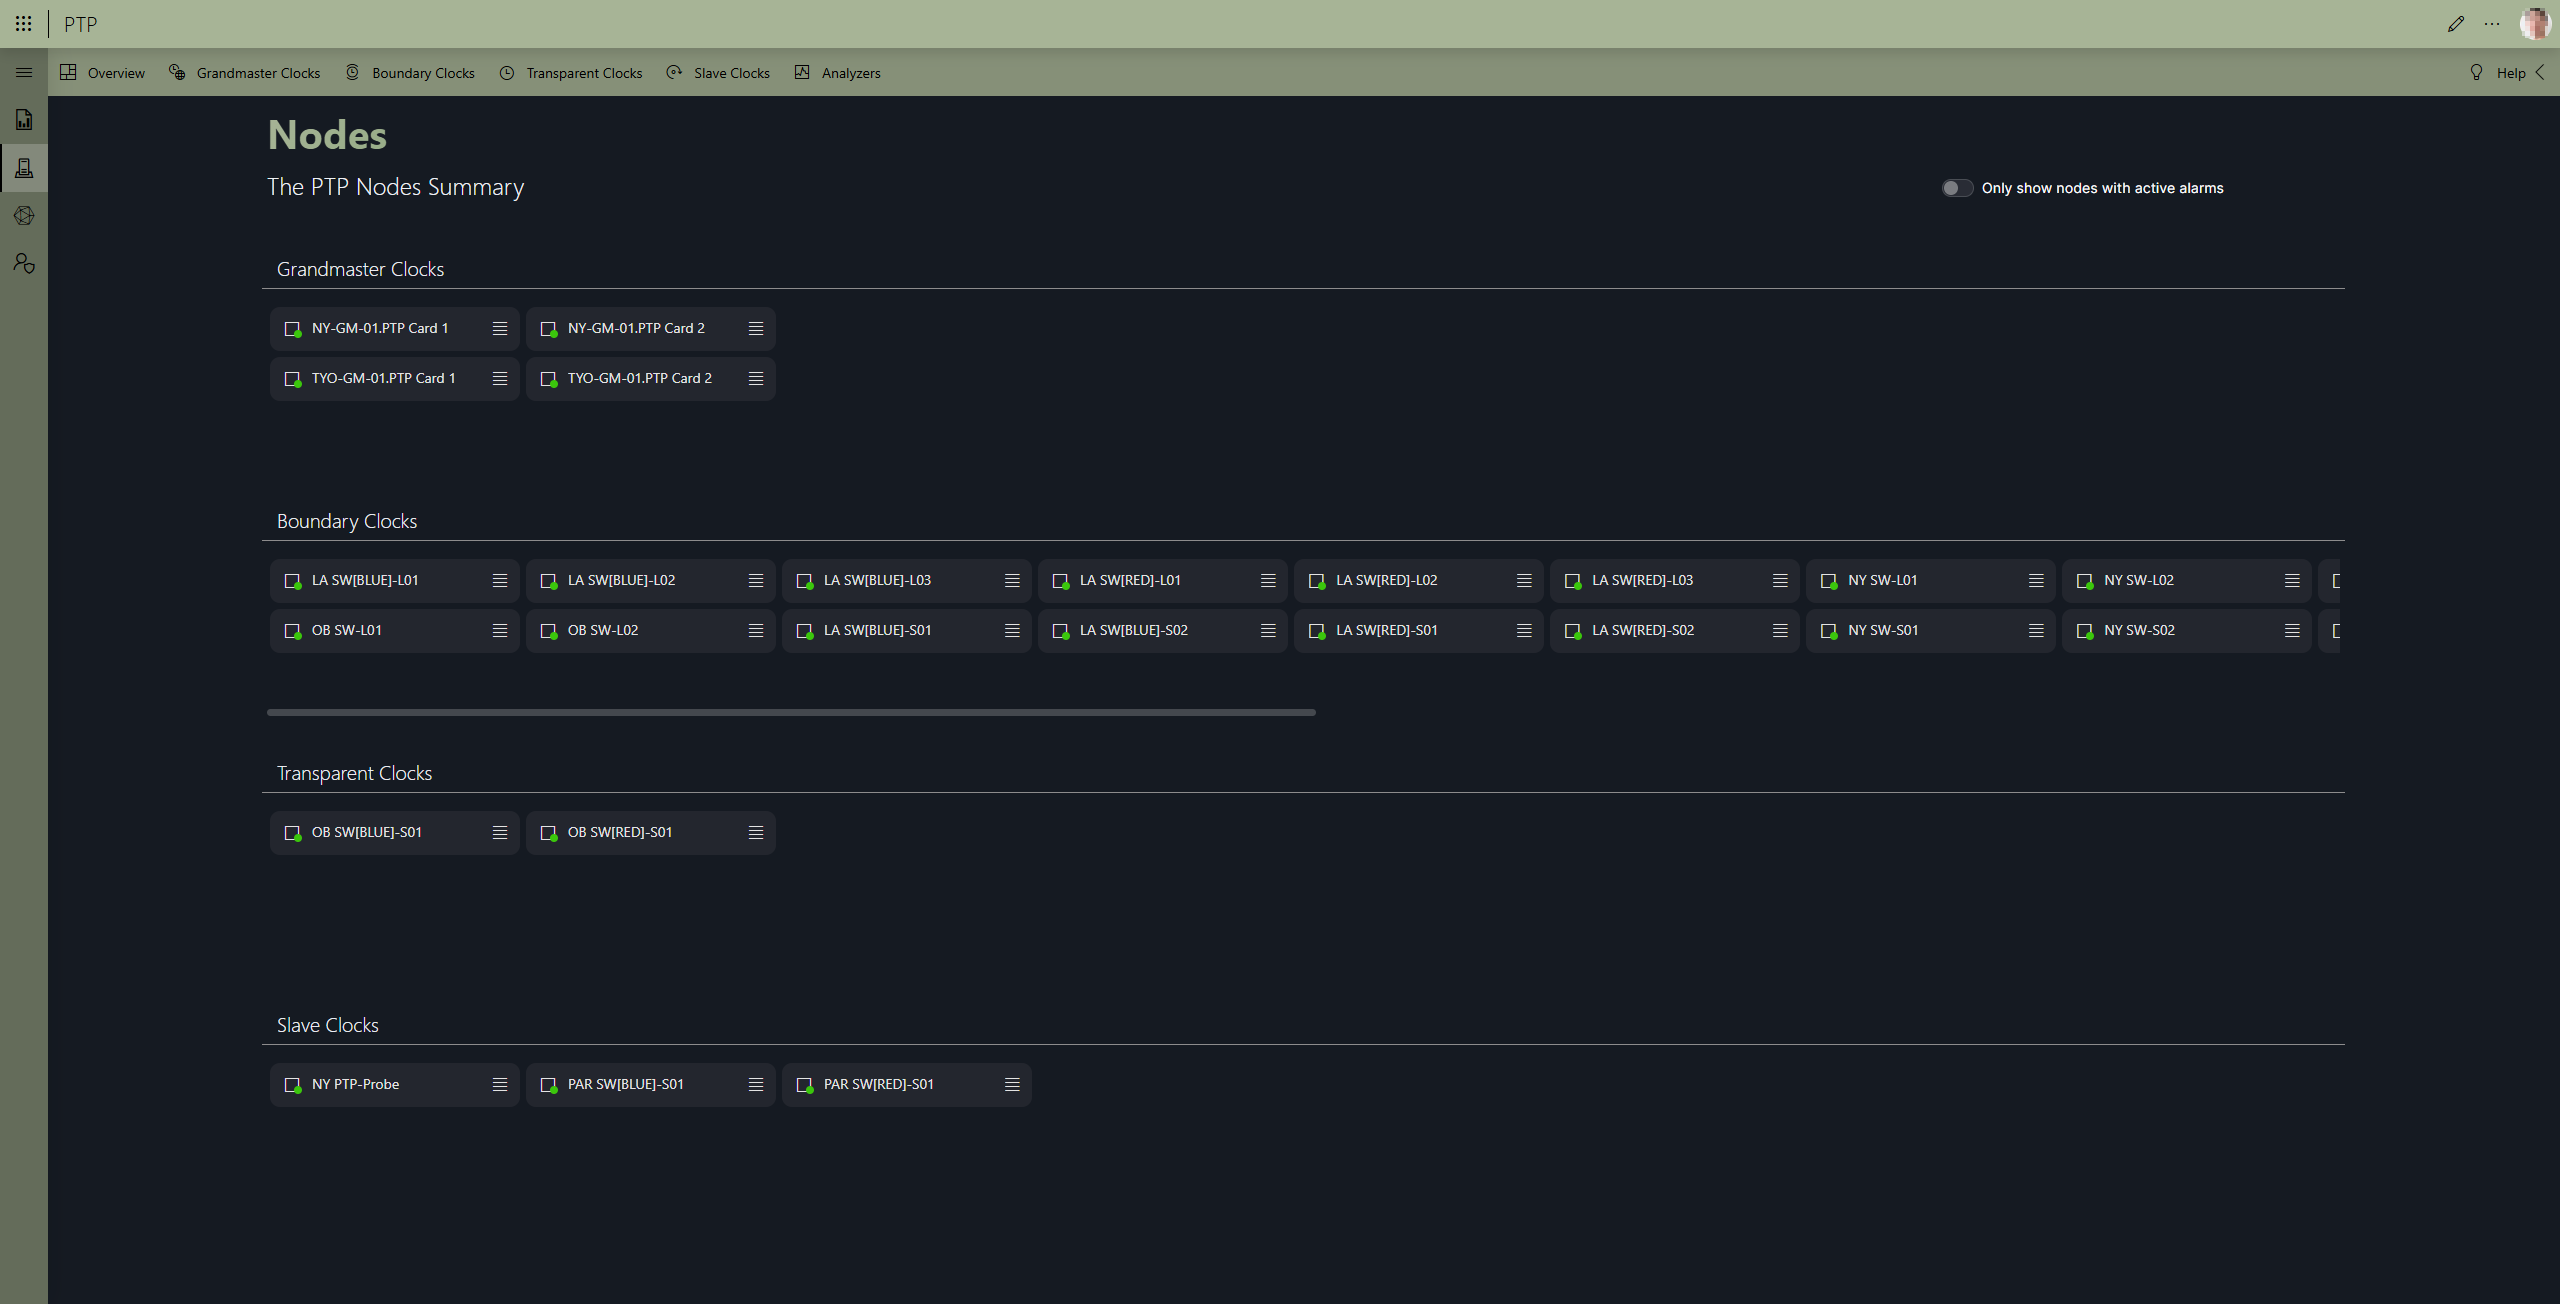
With the button next to each element name, you can open a context menu that provides access to the monitoring app and a details panel for the element.
With the toggle button in the upper-right corner, you can switch to only showing the nodes with active alarms. The alarm states are updated in real time, so there is no need to refresh the page.
In the header bar, several buttons are available that allow easy comparison between multiple nodes of the same clock type.
The Topology page
This page shows a graphical overview of how the different PTP nodes are connected, using DataMiner DCF.
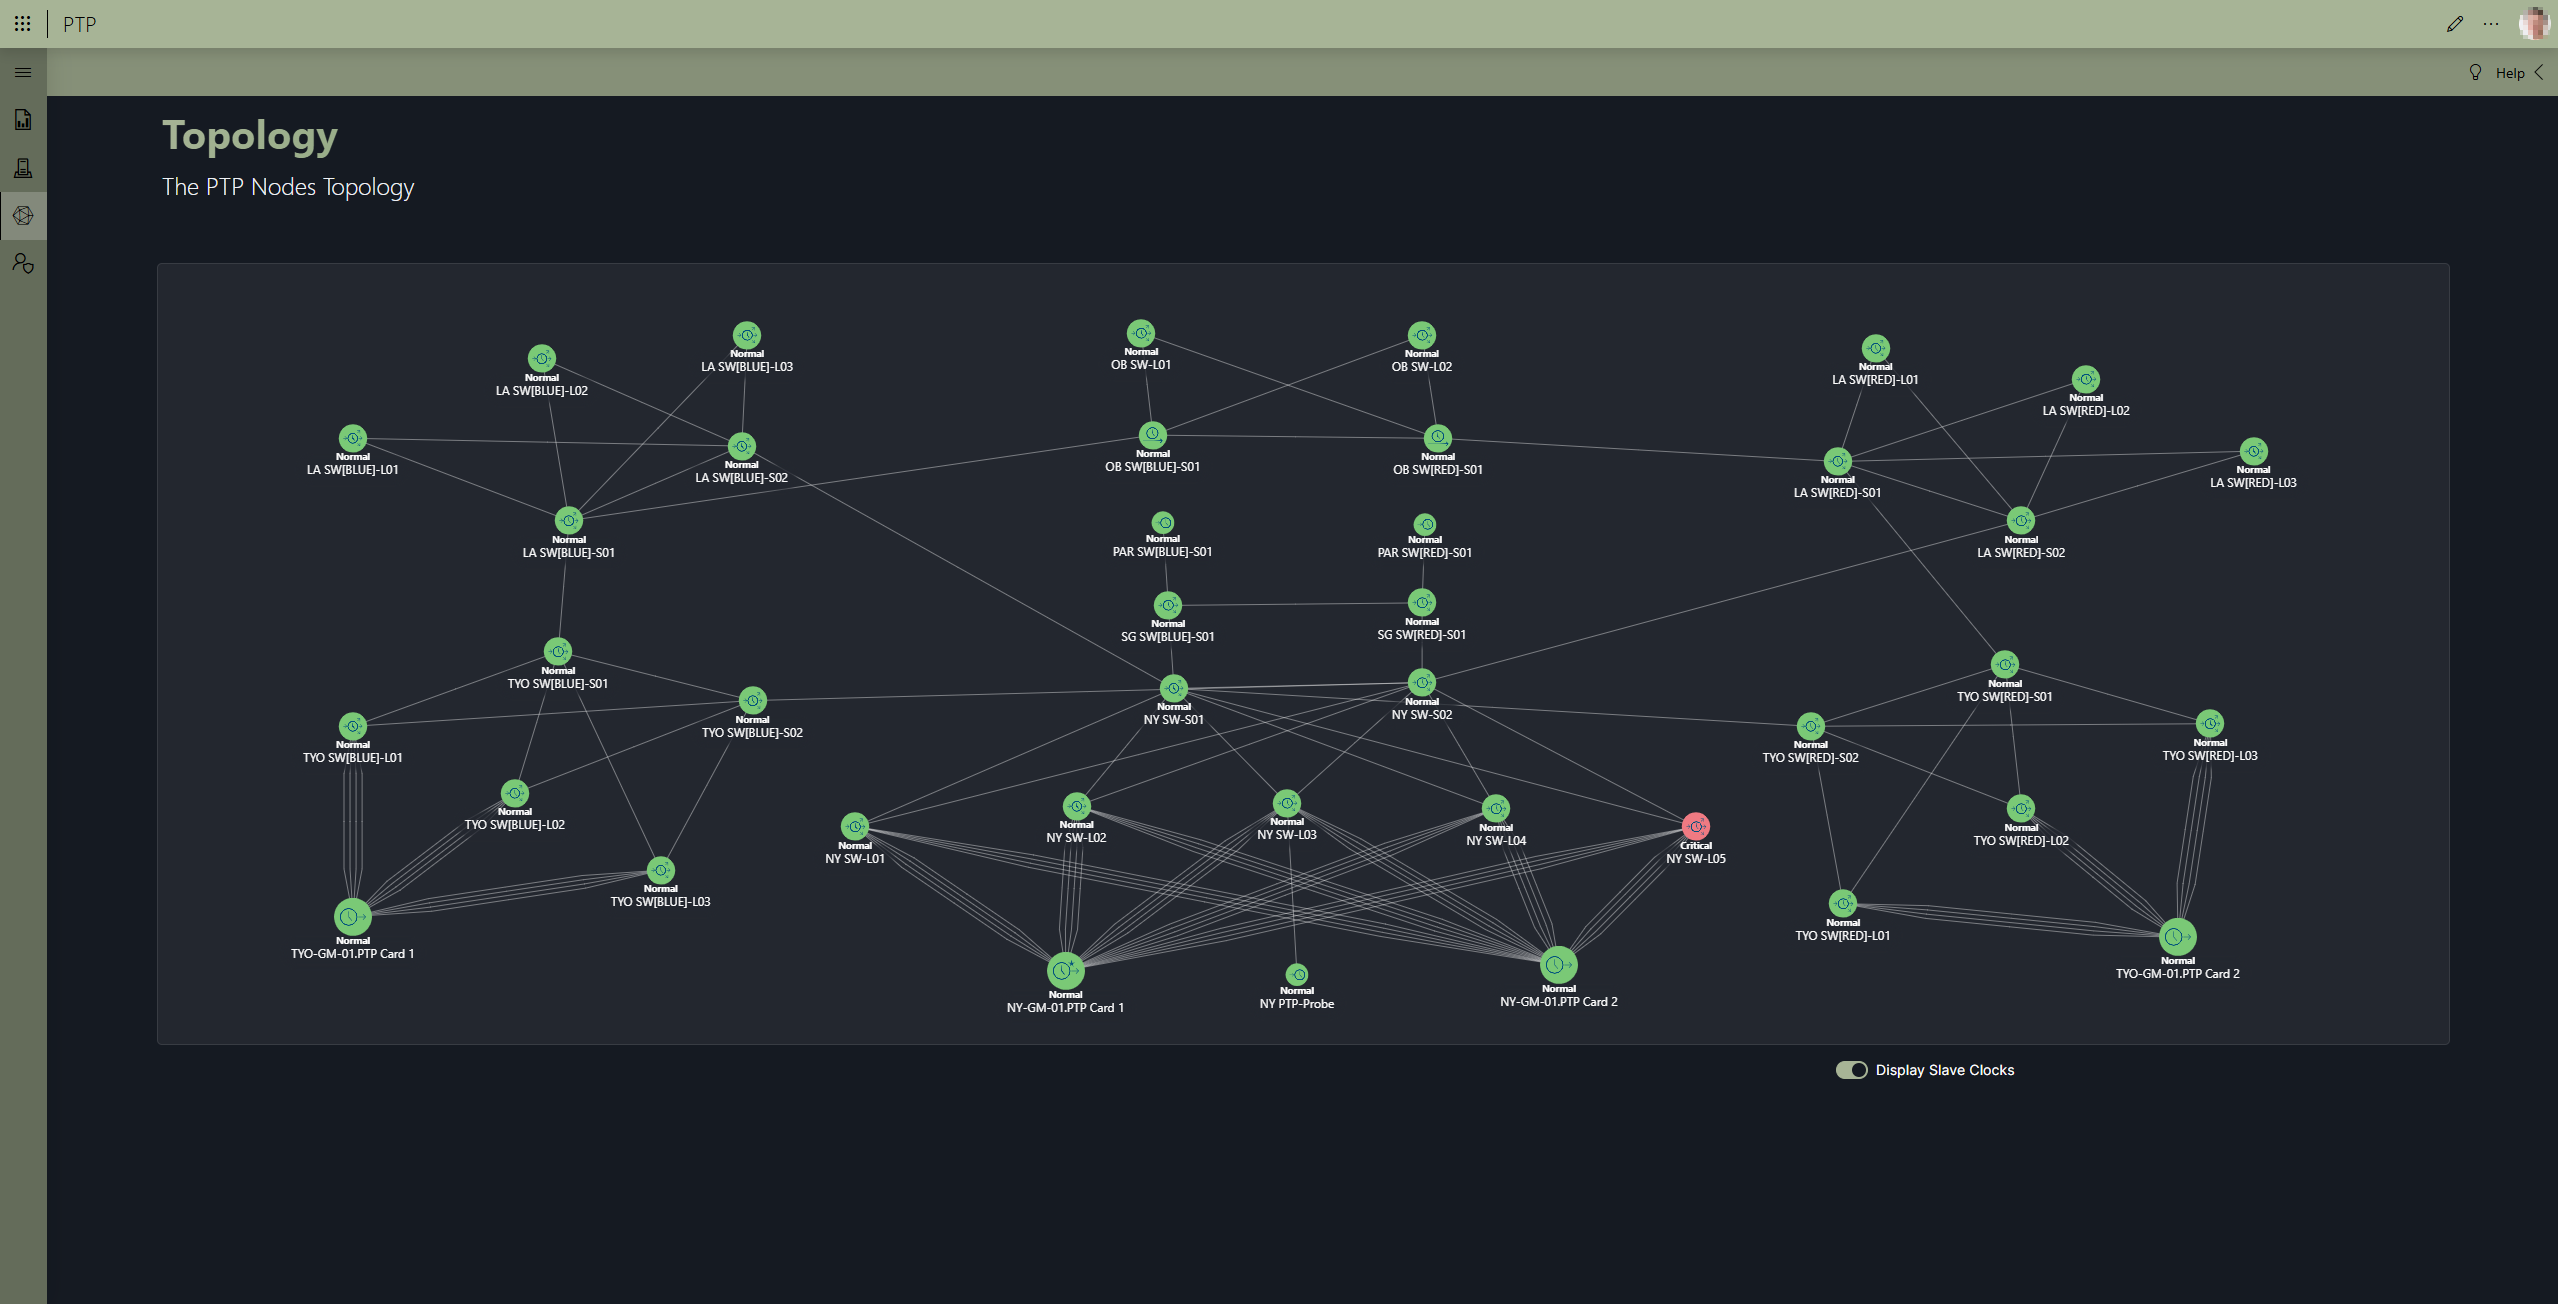
For each node, an icon is displayed indicating the type of node. For more information on these icons, see Types of PTP devices. Note that for the grandmaster clocks, the current active grandmaster (as detected by the PTP probe) is indicated by a small star icon at the top right.
By default, the color of the nodes indicates the PTP state. You can change this to the overall element state by hovering over a node, clicking the Configure color circle in the top right, and selecting the element state instead of the PTP state. Note that this change needs to be done for every clock type separately.
With the toggle button in the lower right corner, you can hide or show the slave clocks in the topology.
To change the position of a node, click and drag the node to its desired position. You can select multiple nodes by holding the Ctrl key.
Note
When you upgrade the PTP Solution to version 1.2.0 or higher, the positions used in the topology from the Cube app will be copied over to the positions for the low-code app. After this upgrade, the positions are not synced in any way.
The Admin page
This page shows all the configured PTP domains. You can add more domains using the Add Domain button.
Two action buttons are available in the table for each domain:
Setup: Launches the setup wizard again, allowing you to reconfigure the PTP domain.
Tip
See also: Installing the PTP app
Asign Roles: Launches the role assignment wizard, allowing you to change the roles that were assigned to the different PTP devices, or to assign roles to newly added devices.