Querying an Elasticsearch database
Below, you can find how to perform a simple query in Kibana.
What is Kibana?
Kibana is a browser-based tool that allows you to connect to and query an Elasticsearch database used by DataMiner.
In case you suspect there are problems with an Elasticsearch database used by DataMiner, it can be useful to connect to the database and query it. This can for instance be useful when the SLDataGateway process shows high CPU usage, when there is a lot of Elasticsearch communication in the network (visible in WireShark), when Elasticsearch uses too many system resources, or when the SRM features in DataMiner seem to respond very slowly.
Note
DataMiner only supports Elasticsearch up to version 6.8. As this version is no longer supported by Elastic, we recommend using DataMiner Storage as a Service instead, or if you want to continue using self-managed storage even though this is not recommended, using OpenSearch.
Warning
Before you perform queries directly on the database, always check with Skyline Communications first, as performing certain queries can have far-reaching consequences on the functionality of your DataMiner System.
Connecting to Kibana
To connect to Kibana:
On the server with the Elasticsearch database, navigate to
C:\Program Files\Elasticsearch\Kibana\binand run Kibana.bat as an administrator.Tip
We recommend running Kibana.bat using an elevated command line, as it takes a while to start the Kibana server and this will allow you to see when it has started.
Open any browser window and navigate to http://ElasticNodeIP:5601 (e.g. http://127.0.0.1:5601) to access Kibana.
Basic queries
Entering queries
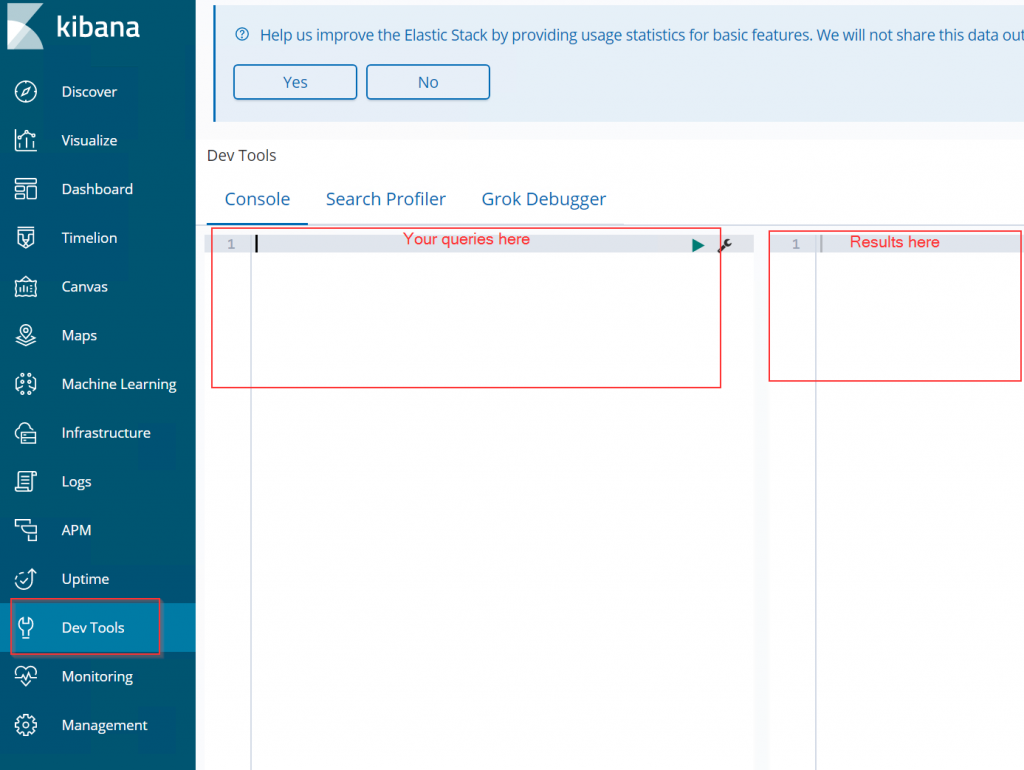
To enter queries, in the bar on the left, navigate to Dev Tools as indicated below:
Retrieving information on indices (tables)
To get relevant information on all indices (i.e. all tables) in the Elasticsearch database, enter the query below. Note that the GET is case-sensitive.
GET _cat/indices
This will return the name of the index, the state of the index, and its size.
Especially the name and state of the index may be interesting for debugging purposes.
Manually setting the replication count for indices
With the queries below, you can alter the number of replicas per shard. This is typically done to configure redundancy and availability based on the number of Elasticsearch nodes you have available.
Tip
If the number of shards you have is too large, decreasing the number of replicas per shard is one option to decrease the strain on the system.
Note
This setting only applies for current data. It does not apply to new data. The newer data added by DataMiner will again have the default number of replicas.
To set the replication count for indices in the Elasticsearch database, first enter the query below:
GET _cluster/health?level=shards&pretty
This will return the name of the indices, the state of the indices, and the number of replicas:
 "indices" : {
    "dms-alarms-2022.06.11.05-000016" : {
      "status" : "green",
      "number_of_shards" : 3,
      "number_of_replicas" : 0,
      "active_primary_shards" : 3,
      "active_shards" : 3,
      "relocating_shards" : 0,
      "initializing_shards" : 0,
      "unassigned_shards" : 0,
      "shards" : {
        "0" :
    },
    "dms-alarms-2023.03.22.10-000063" : {
      "status" : "green",
      "number_of_shards" : 3,
      "number_of_replicas" : 0,
      "active_primary_shards" : 3,
      "active_shards" : 3,
      "relocating_shards" : 0,
      "initializing_shards" : 0,
      "unassigned_shards" : 0,
      "shards" : {
        "0" :
    },
You can then for example set the replica count to 2 for a specific index using the following query:
PUT /<my-index>/_settings
{
  "index" :{
    "number_of_replicas" : 2
  }
}
To set the replica count to 2 for all indices, use the following query:
PUT /_all/_settings
{
  "index" :{
    "number_of_replicas" : 2
  }
}
Retrieving the number of hits + example records
To query a specific index, use the _search functionality:
GET tablename/_search
This query addresses an index (i.e. a table) with a specific table name. For example, to know how many records there are in the table dms-csrmserviceinfo, enter the query GET dms-csrmserviceinfo/_search (see the example below).
The _search indicates that you are doing something similar to a "select" query in SQL; you are in fact searching the data.
For the specified index, the query will return the number of hits (i.e. number of records) as well as the first couple of records. This allows you to get an idea of what the index contains. This is suitable for if you want to have an idea about which data the index contains.
Clearing an index
Warning
Always check with Skyline Communications first before you do this, as clearing an index can have far-reaching consequences on DataMiner functionality.
Clearing an index is similar to truncating a table in SQL. It will remove all the data in an index (or in a table in SQL). If an index needs clearing, use the following query:
POST tablename/_delete_by_query
{
  "query":{
    "match_all":{

    }
  }
}
Like before, replace "tablename" by the actual table name in the query.
The query will remove all the data (match_all query). For this, the "POST" verb is required as well as "query" and "match_all".
Querying a specific index
Important
There are many more filtering possibilities in Elasticsearch than mentioned here. This is merely an example that may be relevant.
Sometimes, you may want to query or filter out a specific record. One way to do this is to use the "match" query:
GET tablename/_search
{
  "query": {
    "match": {
      "_id": "665/66283"
    }
  }
}
The query above will simply get the records for "tablename" that match _id 665/66283.
Retrieving information from a specific time onwards
To retrieve all results in a specific table from a specific time onwards, you can use a query like the one illustrated below.
GET tablename/_search
{
  "query": {
    "range": {
      "TimeOfArrival": {
          "gt":"2020-06-30T13:19:36Z"
       }
    }
  }
}
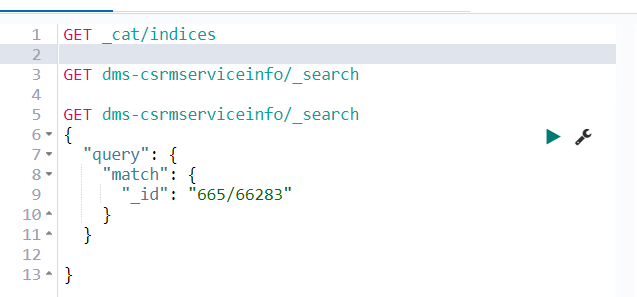
Queries in Kibana
The screenshot below illustrates what the queries will look like in Kibana. Note that there is no need to comment out any single query. Instead, you can run separate queries on their own by clicking the little triangle to the right of the query. Additionally, no semicolon is required after a query.
Example: checking an oversized dms-csrmserviceinfo index
In certain circumstances, the dms-csrmserviceinfo index (i.e. table) might become too large, causing problems in DataMiner. Below, you can find how you can check the size of this table.
Note that it is outside the scope of this article to discuss what exactly "too large" entails for a specific table. For more information on this and on how to resolve such a situation, contact Skyline Communications.
To find out how many records this index has, apply the following query:
GET dms-csrmserviceinfo/_search
This will return the number of records like this:
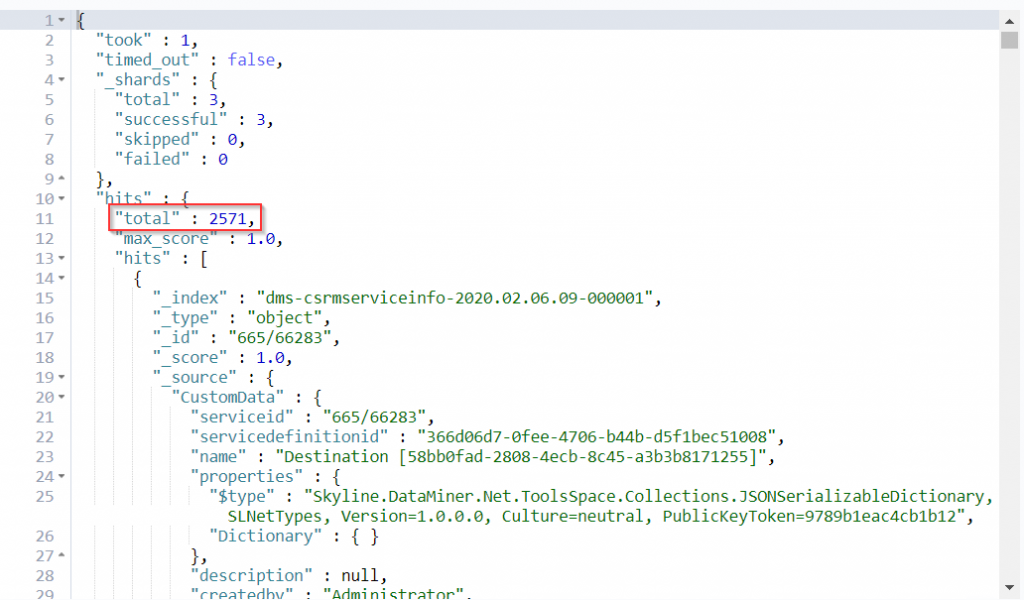
In the image above, you can see that the index in the example has only 2571 records, which means it is not too large.