Line & area chart
This component can be used to display a trend graph.
Note
- From DataMiner 10.0.11 onwards, if this type of component is added, the time span displayed by the component is available as a feed in the data pane, so that this can be applied to other components.
- From DataMiner 10.2.0 [CU10]/10.3.1 onwards, this component also supports line graphs for string parameters.
Configuring the component
To configure the component:
Apply one or more parameter data feeds. See Applying a data feed.
Note
- If a query is used as the data feed, additional configuration is required. See Configuration with query data feed.
- Prior to DataMiner 10.2.0 [CU10]/10.3.1, you can use a table component to feed a line chart by linking the Parameters feed and the Indices feed. From DataMiner 10.2.0 [CU10]/10.3.1 onwards, you only need to link the Parameters feed of the table to the line chart in order to see the data, similar to when you use a parameter feed component.
Optionally, apply a filter feed:
In case a parameter data feed included a parameter based on a protocol, a filter feed can be used to filter on a specific element.
For a table parameter, an indices filter feed is supported.
From DataMiner 10.0.2 onwards, in a system using Service & Resource Management, you can add resources as a feed to make the graph display the resource capacity parameters as a stacked trend chart. If you then click the chart and select a point in time, the legend lists all bookings for that specific point in time. See Service and Resource Management.
From DataMiner 10.2.0/10.1.3 onwards, a parameter table filter feed is supported if the URL option showAdvancedSettings=true is used. This type of filter supports both VALUE and FULLFILTER syntax. For more information on this syntax, see Dynamic table filter syntax.
Note
When you update a filter that is already used in the component, re-add the filter in order to update it in the component.
From DataMiner 10.2.0/10.1.4 onwards, you can select view parameters as a data source to view trending for aggregation rules on specific views. To select these, in the drop-down box for the parameter data source, select View.
Optionally, customize the following component options in the Component > Settings tab:
WebSocket settings: Allows you to customize the polling interval for this component. To do so, clear the checkbox in this section and specify the custom polling interval.
Trend span: Allows you to customize the time span for which trending is displayed. You can either select a predefined time span or select Custom and specify a start and end time.
Value range > Fixed minimum/Fixed Maximum: Available from DataMiner 10.0.13 onwards. These settings allow you to configure a minimum and/or maximum range for the chart, so that no values outside this range are displayed. The configured range will apply to all lines in the chart, regardless of any particular axis or displayed parameter. By default, no limits are applied.
Minimum visible gap size: Allows you to specify the minimum duration a gap must have before it is displayed in the graph. By default, this is set to 0.
Trend points: Available from DataMiner 10.2.0/10.2.3 onwards. Determines which type of trend data points are added to the graph: Average (changes only), Average (fixed interval), or Real-time. By default, Average (changes only) is selected. This setting will also be taken into account when you export the chart to CSV.
Trend points interval: Available from DataMiner 10.3.5/10.4.0 onwards, but only if Trend points is set to an average type. Determines how much time there is between each trend point that is being tracked or analyzed. This interval is also used when exporting the data. You can set this to Auto (i.e. an interval relative to the specified trend span), Five minutes, One hour, or One day.
Show real-time trend data: If real-time trending is available, this box allows you to set the chart to display real-time trending instead of average trending.
Show average: Available from DataMiner 10.0.13 onwards, if Show real-time trend data is not selected. Displays the average trend data. By default, this is enabled.
Show minimum: Available from DataMiner 10.0.13 onwards, if Show real-time trend data/Stack trend lines is not selected. Displays the minimum trend data. By default, this is disabled.
Show maximum: Available from DataMiner 10.0.13 onwards, if Show real-time trend data/Stack trend lines is not selected. Displays the maximum trend data. By default, this is disabled.
Group by: In case the component displays trending for multiple parameters, this box allows you to specify how the graphs should be grouped. One graph will be displayed per group. The default setting (from DataMiner 10.3.2/10.4.0 onwards) is All together.
Note
View parameters can only be grouped together with other parameters with the option All together, otherwise they are placed in a separate group.
Use percentage based values: This option is only displayed if the component displays resource capacity information. If you select this option, the chart will display percentage values instead of absolute values.
Optionally, fine-tune the component layout. In the Component > Layout tab, the following options are available:
The default options available for all components. See Customizing the component layout.
Layout: In case the component will display multiple trend charts, this section allows you to configure how these charts are displayed:
Type: Determines whether the different charts are displayed next to each other or below each other. However, note that when the charts are viewed on a small screen, they will always be displayed below each other.
Maximum rows per page: Determines how many charts can at most be displayed below each other on a single page.
Maximum columns per page: Determines how many charts can at most be displayed next to each other on a single page.
Chart limit: Determines how many parameters can at most be displayed in one chart. By default, this is set to 16 parameters.
Chart limit behavior: Available from DataMiner 10.0.13 onwards. Determines what happens when the number of parameters in the chart exceeds the defined chart limit:
Disable parameters in legend: The excess parameters are disabled in the chart but remain available in the chart legend, so that they can be enabled again manually. This option is selected by default, and is also the default behavior prior to DataMiner 10.0.13.
Create additional charts: Additional charts are displayed that include the parameters that exceed the limit. If necessary, multiple additional charts will be displayed, each respecting the configured limit.
Styling and Information > Show range selector: Determines whether a preview graph is displayed below the main graph, allowing you to easily select a different range.
Styling and Information > Line thickness: Allows you to specify the thickness of the data line in the chart (in pixels).
Styling and Information > Highlight lines on hover: Available from DataMiner 10.2.0/10.1.1 onwards. Determines whether a trend line is highlighted when you hover over the line in the graph or over the corresponding parameter in the trend legend. When a line is highlighted, it gets the thickness determined by the Highlight line thickness setting, which becomes available when this option is selected.
Note
If you hover over a parameter in the trend legend, lines on different charts with this same parameter name will also be highlighted. This can be useful to easily compare related lines in different charts.
Styling and Information > Enable legend: Allows you to disable the legend for the line chart. This is especially used for line charts within Group components, in order to avoid duplicate legends.
Styling and Information > Expand legend initially: Select this option to immediately show the trend legend in the component. Otherwise, the legend section is initially collapsed, and you can display it using the arrow icon next to the graph.
Styling and Information > Hide non-trended parameters: Available from DataMiner 10.0.9 onwards. Determines whether parameters are shown in the legend of the graph if they have no trend data available. If the option is selected, these parameters are hidden. By default, it is not selected in the most recent DataMiner versions, but it is selected by default prior to DataMiner 10.3.9/10.4.0. Prior to DataMiner 10.3.0/10.2.12, this option is named Hide parameters without trend data in the legend.
Note
Prior to DataMiner 10.3.9/10.4.0, when a line chart component used element table column parameters as data and indices as filter, it would cross-match indices across the unique elements associated with the table column parameters. This behavior is prevented by disabling the Hide non-trended parameters option, enhancing the performance of these visualizations.
Fill graph: Available from DataMiner 10.2.0/10.1.6 onwards. Select this option to have the space underneath the line filled with the line color.
Stack trend lines: Available from DataMiner 10.2.0/10.1.6 onwards. Select this option to stack the lines in the graph on top of each other. This option is not compatible with the Show min/max shading, Show minimum and Show maximum options. When you select the Stack trend lines option, those options will therefore be disabled and hidden.
Styling and Information > Show min/max shading: Select this option to display a semi-transparent shade above and below the trend line, showing the minimum and maximum trend values. This option can only be used for parameters with average trending and only in case the Y-axis has no discrete values.
Styling and Information > Show time range buttons: Available from DataMiner 10.3.4/10.4.0 onwards. Enables a number of time range buttons that allow you to select one of the preset time ranges: 1 day (last 24 hours), 1 week (last 7 days), 1 month (last 30 days), 1 year (last year), and 5 years (last 5 years). By default, this setting is disabled.
Additional lines > Line thickness: If you select to show any additional lines with the options below, this option becomes available, allowing you to customize the thickness of these lines (in pixels).
Additional lines > Show percentile: Displays a percentile line on the graph. When you select this option, two additional options become available that allow you to configure this percentile line: Percentile, which allows you to indicate which percentile should be displayed, and Percentile line color.
Note
From DataMiner 10.2.0/10.1.1 onwards, the percentile calculation takes into account how long the parameter had a specific value. This means that if a particular value is present for a longer time than other values, it will get more weight in the calculation. For discrete parameters or graphs showing multiple parameters, no percentile is calculated.
Additional lines > Show boundary lines: Allows you to display one or more boundary lines. You can configure where a line should be displayed by adding a Y-axis value in the Boundary value box. The color of a boundary line can be customized in the Boundary line color box. The Add boundary line option below this allows you to add additional boundary lines. To remove a boundary line, click the x to the right of the line name.
Advanced > Empty Result message: Available from 10.3.11/10.4.0 onwards. Allows you to specify a custom message that is displayed when a query returns no results.
Tip
See also: Displaying a custom empty component message.
Configuration with query data feed
Query results are supported as a data feed for this component from DataMiner 10.2.9/10.3.0 onwards. To configure the component to use a GQI query as its data feed:
Create a query data feed. See Creating a GQI query.
In the Component > Settings tab, configure the following fields in the Dimensions section:
- Query: The query data feed you want to use.
- X axis: The column that should be used for the X-axis data.
- Y axis: The column that should be used for the Y-axis data.
Note
Data points are connected by a line in the order they appear in the query result. If you want to create a trend line, make sure the query results are sorted on the desired axis column.
Fine-tune the component layout and settings like for a regular line and area chart. See Configuration.
Export to CSV
It is possible to export the trend data to CSV. To do so, click the ... icon in the top-right corner of the component and select Export to CSV. The CSV file will then be generated in the background. To ensure that it is generated correctly, do not change the configuration of the component until the CSV export is completed.
Note
- The separator used in CSV exports is based on the CSV separator setting in Cube. If this setting cannot be retrieved, the local browser settings are used instead.
- From DataMiner 10.3.3/10.4.0 onwards, the Show average, Show minimum, and Show maximum settings are also taken into account when you export a chart to CSV. In addition, if the Show min/max shading option is enabled, minimum and maximum values will always be taken into account in the export.
Examples
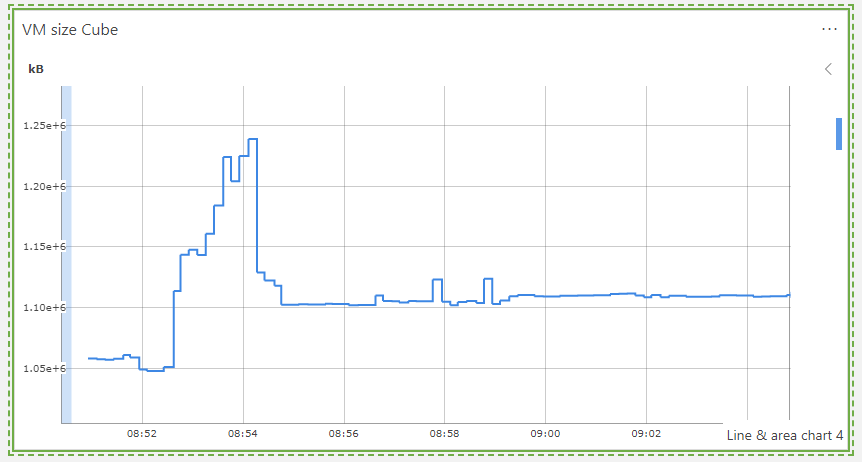
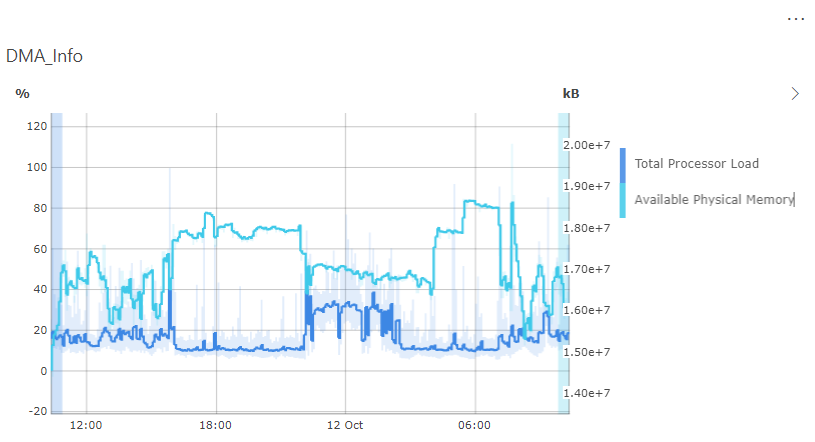
Trend graph showing DMA KPIs
To add a component to a dashboard to show a basic trend graph with several DMA KPIs:
In edit mode, drag the Line & area chart visualization to the dashboard.
Click the
 icon to filter the available data in the data pane.
Expand the Parameters section in the data pane and specify the element representing the DMA in the Element box.
Select a parameter you want to display in the graph, and drag it to the graph. Repeat this for each parameter that should be displayed in the graph.
Tip
Select the Trended checkbox at the top of the Parameters section to only view parameters for which trending is enabled. Depending on your DataMiner version, you may need to select the filter icon first.
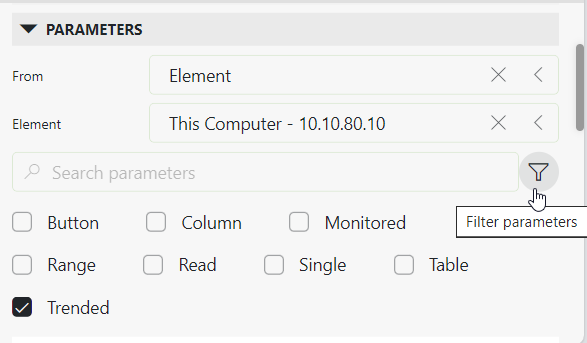
Parameters section with filter in DataMiner 10.3.11In the Settings tab, in the Group by box, select Element. This way all KPIs will be shown in the same graph.
Trend graph showing DMA trend data using profile parameters
To add a component to a dashboard to show a basic trend graph using profile parameters:
In edit mode, drag the Line & area chart visualization to the dashboard.
Click the
icon to filter the available data in the data pane.Expand the Profile parameters section in the data pane.
If you have configured it correctly in DataMiner Cube, there should be a profile parameter linked with a protocol and a trended parameter of the data you want to see.
Select the profile parameter you want to display in the graph, and drag it to the graph.
Expand the Elements section in the data pane, select the element you want to display in the graph, and drag it to the graph.