Pie & donut chart
This component displays the results of queries in a chart shaped like a pie or donut.
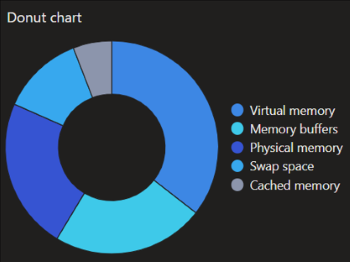
Donut chart in DataMiner 10.4.5
To configure the component:
Apply query data. See Creating a GQI query.
Optionally, customize the following component options in the Component > Settings pane:
Label: Allows you to select which data should be used as a label.
Segment size: Allows you to select which data should determine the size of segments in the chart.
Note
From DataMiner 10.3.7/10.4.0 onwards, when you add a query to the component, the label and segment size will automatically be configured.
Optionally, fine-tune the component layout. In the Component > Layout pane, the following options are available:
Chart shape: Can be set to Pie or Donut.
Legend > Show Legend: Determines whether the legend is displayed.
Legend > Show Legend: If the legend is set to be displayed, this option determines whether it is displayed on the left, on the right, at the top or at the bottom of the visualization.
Tooltips > Show Tooltips: Determines whether tooltips are displayed.
Tooltips > Include label: Determines whether the label is included in tooltips.
Tooltips > Include dimension: Determines whether the dimensions are indicated in tooltips.
Tooltips > Include value: Determines whether values are indicated in tooltips.
Tooltips > Include percentages: Determines whether percentages are indicated in tooltips.
Advanced > Empty Result message: Available from 10.3.11/10.4.0 onwards. Allows you to specify a custom message that is displayed when a query returns no results.
Tip
See also: Displaying a custom empty component message.