Trend statistics
This component displays the minimum, average and maximum value of one or more trended parameters.
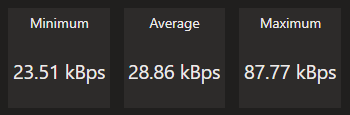
Trend statistics component in DataMiner 10.4.5
To configure the component:
Add (multiple) parameter data sources.
In case a table parameter has been added, optionally add an index filter.
Optionally, customize the following component options in the Component > Settings pane:
WebSocket settings: Allows you to customize the polling interval for this component. To do so, clear the checkbox in this section and specify the custom polling interval.
Trend span: Allows you to customize the time span for which trend statistics are displayed. You can either select a predefined time span or select Custom and specify a start and end time.
Group by: In case the component displays trend statistics for multiple parameters, this box allows you to specify how the statistics should be grouped.
Optionally, fine-tune the component layout. In the Component > Layout pane, the following options are available:
The default options available for all components. See Customizing the component layout.
Layout: In case trend statistics are displayed for multiple parameters, this setting determines whether the blocks of statistics are displayed next to each other or below each other. However, note that when the statistics are viewed on a small screen, they will always be displayed below each other.
Maximum rows per page: Determines the maximum number of parameters for which statistics can be displayed below each other on a single page.
Maximum columns per page: Determines the maximum number of parameters for which statistics can be displayed next to each other on a single page.