Pivot table
This component displays a status report for a number of parameters of the elements using the selected protocol and protocol version.
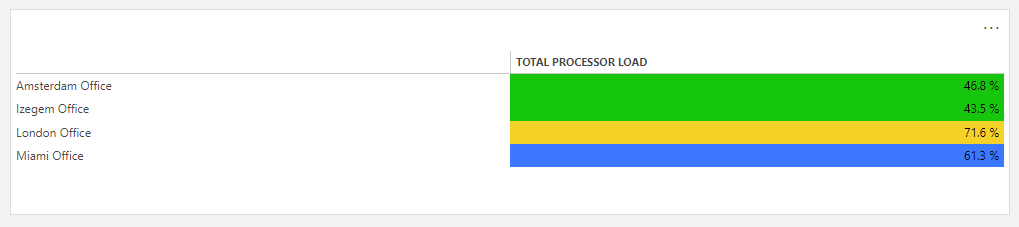
Pivot table component in DataMiner 10.4.6
It is possible to export this status report to CSV. To do so, click the ... icon in the top-right corner of the component and select Export to CSV. The CSV file will then be generated in the background. To ensure that it is generated correctly, do not change the configuration of the component until the CSV export is completed.
Note
The separator used in CSV exports is based on the CSV separator setting in Cube. If this setting cannot be retrieved, the local browser settings are used instead.
To configure the component:
-
This component requires parameter data based on Protocol or Element, or a group of parameters from a parameter picker component.
In case protocol parameter data is used, you can add additional element or view data as a filter.
In case element parameter data is used, you can add additional view data as a filter.
If table parameter data is used, you can add additional indices data as a filter.
In the Settings pane, you can fine-tune the component:
Auto-expand rows: Depending on the added data, the pivot table can consist of rows that can be expanded to view all data related to that row. If this option is selected, these rows will be expanded automatically.
Items to include: Allows you to configure which information should be included in the table and where it should be displayed.
Add trend statistics: Adds trend statistics (minimum, average and maximum values) to the component, if trending is enabled for the selected parameters.
If this option is selected, a trend statistics row is included in the Items to include section, allowing you to determine where the statistics are displayed. In addition, a Trend span option will be displayed, allowing you to select a different time span for which statistics are displayed.
Note
A pivot table that displays trend statistics can use data exposed by a time range component as a filter.
Limit: Determines how many rows (i.e. indices) or elements can be displayed. If a particular number “X” is specified, only the X first rows or elements that are retrieved from the server will be displayed.
Filter: In case table column parameter data is used, this box allows you to specify a table row filer. To combine multiple filters, use a semicolon, e.g. SLA*;SLP*.
Conditions: Allows you to add conditions, so that for example an element is only displayed if a particular parameter has a particular value.
Sort: Allows you to select a protocol (if the pivot table contains multiple protocols) and parameter by which the table should be sorted.
Sort > Sort ascending: Determines the order in which the pivot table is sorted. If you clear this checkbox, it is sorted in descending order.
Note
Using the sort settings in conjunction with the Limit setting, you can create a top X or bottom X list.
Optionally, fine-tune the component layout. See Customizing the component layout.