Viewing spectrum analyzer traces
Spectrum trace acquisition
As soon as you open the spectrum analyzer card, trace acquisition begins, using the last used settings. The trace is then displayed in the real-time display section.
The speed at which a trace is acquired depends on:
Settings such as the resolution bandwidth and frequency span
The current workload of the spectrum analyzer you are using (because of other real-time users and script executions).
Note
It is possible to hide the current trace, and instead show for instance the minimum or maximum hold, or the average trace. See Displaying the minimum and maximum hold of the trace and Displaying the average trace.
You can choose these options in the trace tab of the ribbon, or you can right-click the trace in the info pane, and select what is to be displayed.
Copying spectrum information from the real-time display
You can either copy the information from the real-time display to the clipboard, or save it directly to a file.
In order to copy information from a spectrum analyzer card to the clipboard:
Go to the main tab of the ribbon.
Click Copy, and select:
Marker and reference line info, to copy the current marker and reference line settings to the clipboard as text.
Settings, to copy the spectrum settings to the clipboard as text.
Trace image, to copy an image of the trace to the clipboard.
Note
This option is also available via the right-click menu of the display area.
To save the real-time display as a .jpg file instead:
Go to the main tab of the ribbon.
Click Save to file, and select:
Trace image, to save only the displayed trace.
Trace image and info panel, to save the displayed trace along with the info panel.
Note
This option is also available via the right-click menu of the display area.
Toggling the Automatic standby mode
If DataMiner Cube detects no activity from the user for some time, the display is set to standby. As soon as you move the mouse pointer over the display, the real-time display of the trace is resumed. You can switch this automatic standby mode on and off, and change the interval after which the display is set to standby.
To do so, on the spectrum analyzer card in DataMiner Cube, go to the trace tab. The following options are available in the Standby section:
To switch standby mode on, select Automatic standby mode.
To switch standby mode off, clear the selection from Automatic standby mode.
To change the number of minutes DataMiner will wait before setting the display to standby, next to Inactivity period, enter a different value.
Freezing/unfreezing the trace
It is possible to manually freeze and unfreeze the trace. To do so:
On the spectrum analyzer card, go to the trace tab.
Use one of the following options:
To freeze or unfreeze the trace, or to step to the next trace, in the Show controls section, select Freeze/step controls and use the buttons at the bottom of the real-time display.
To Freeze display, Unfreeze display or Freeze on next trace, use the corresponding freeze / step options in the Freeze / step section.
Note
When the display is in frozen mode, Frozen is displayed in the middle of the graph area.
Zooming and panning
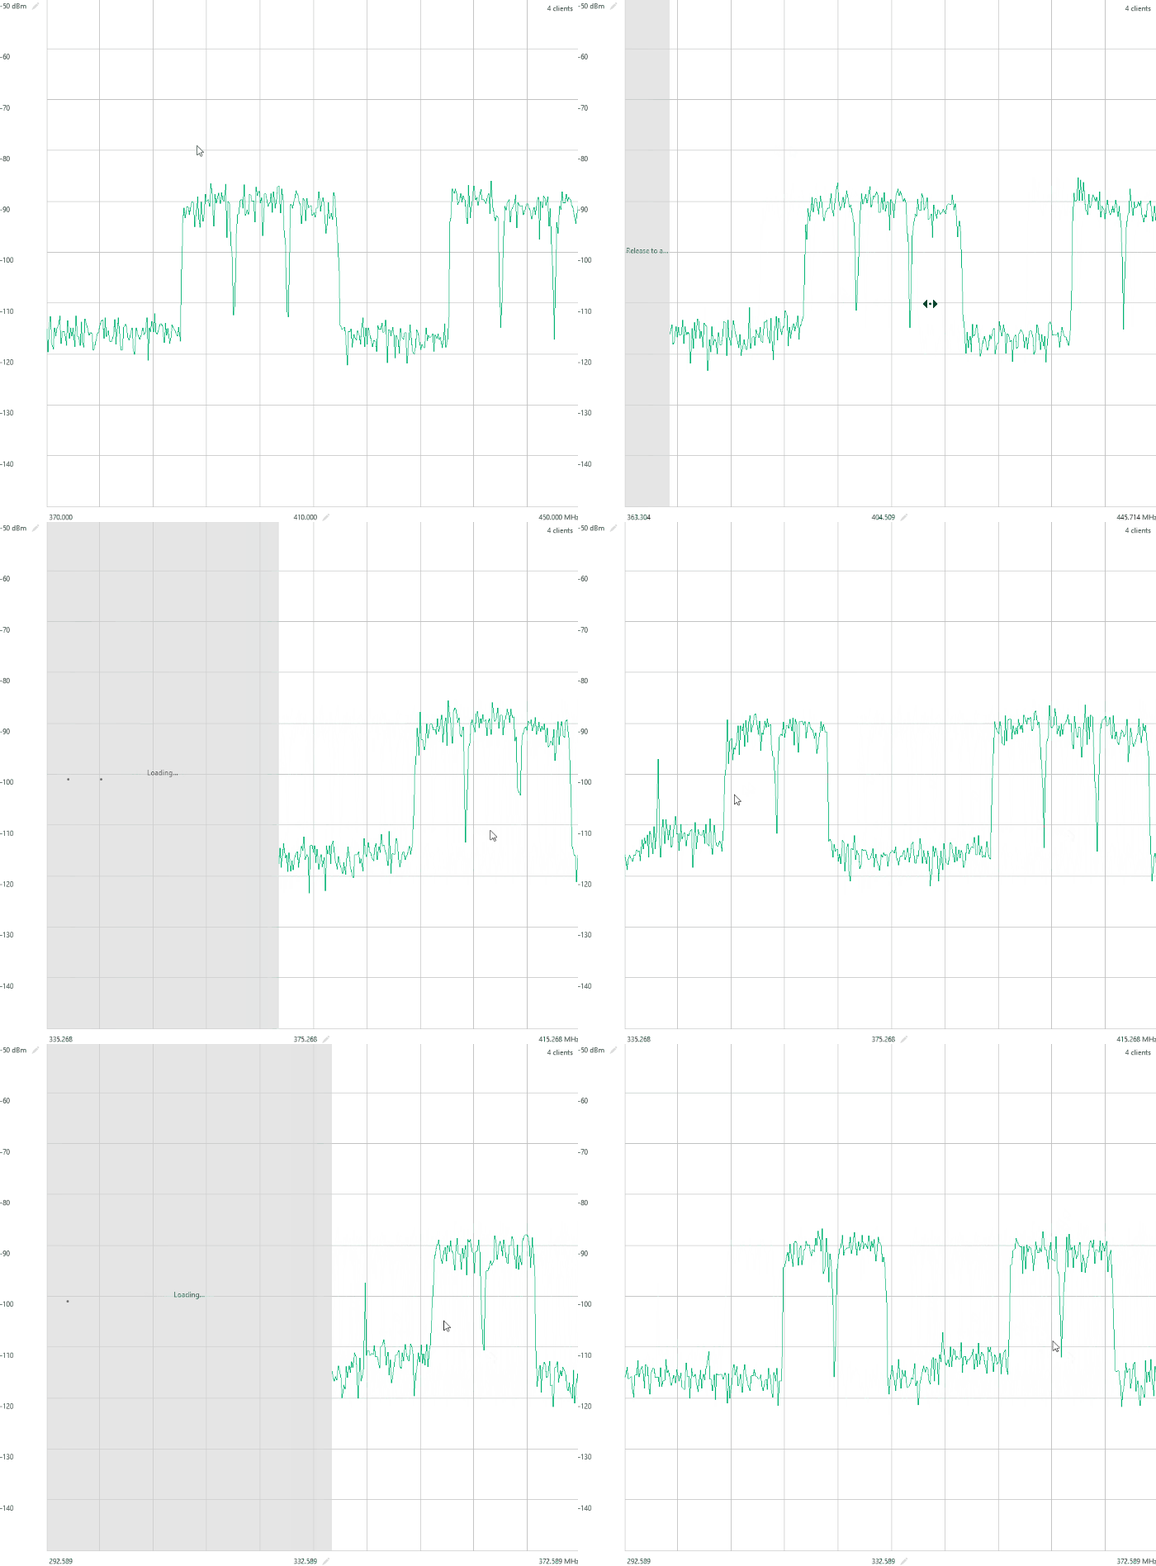
Panning the trace is supported from DataMiner 10.3.11/10.4.0 onwards:
To pan horizontally, click the trace and drag your mouse.

Spectrum analyzer trace in DataMiner 10.4.1The following will happen:
The trace moves to the left or right while being refreshed at a rate equal to the original rate.
The unknown part of the trace (i.e. the frequency range located outside of the original span) is visualized as a gray area with a grid in the background.
The frequency labels on the X axis are updated continuously to reflect the ongoing change.
When you release the mouse button, the info pane to the right of the display section will automatically update with start, stop, and center frequencies that align with the new data. A new trace based on the updated center frequency will replace the gray area.
Note
Horizontal panning is only available when the spectrum protocol includes the Start frequency, Stop frequency, and Center frequency parameters.
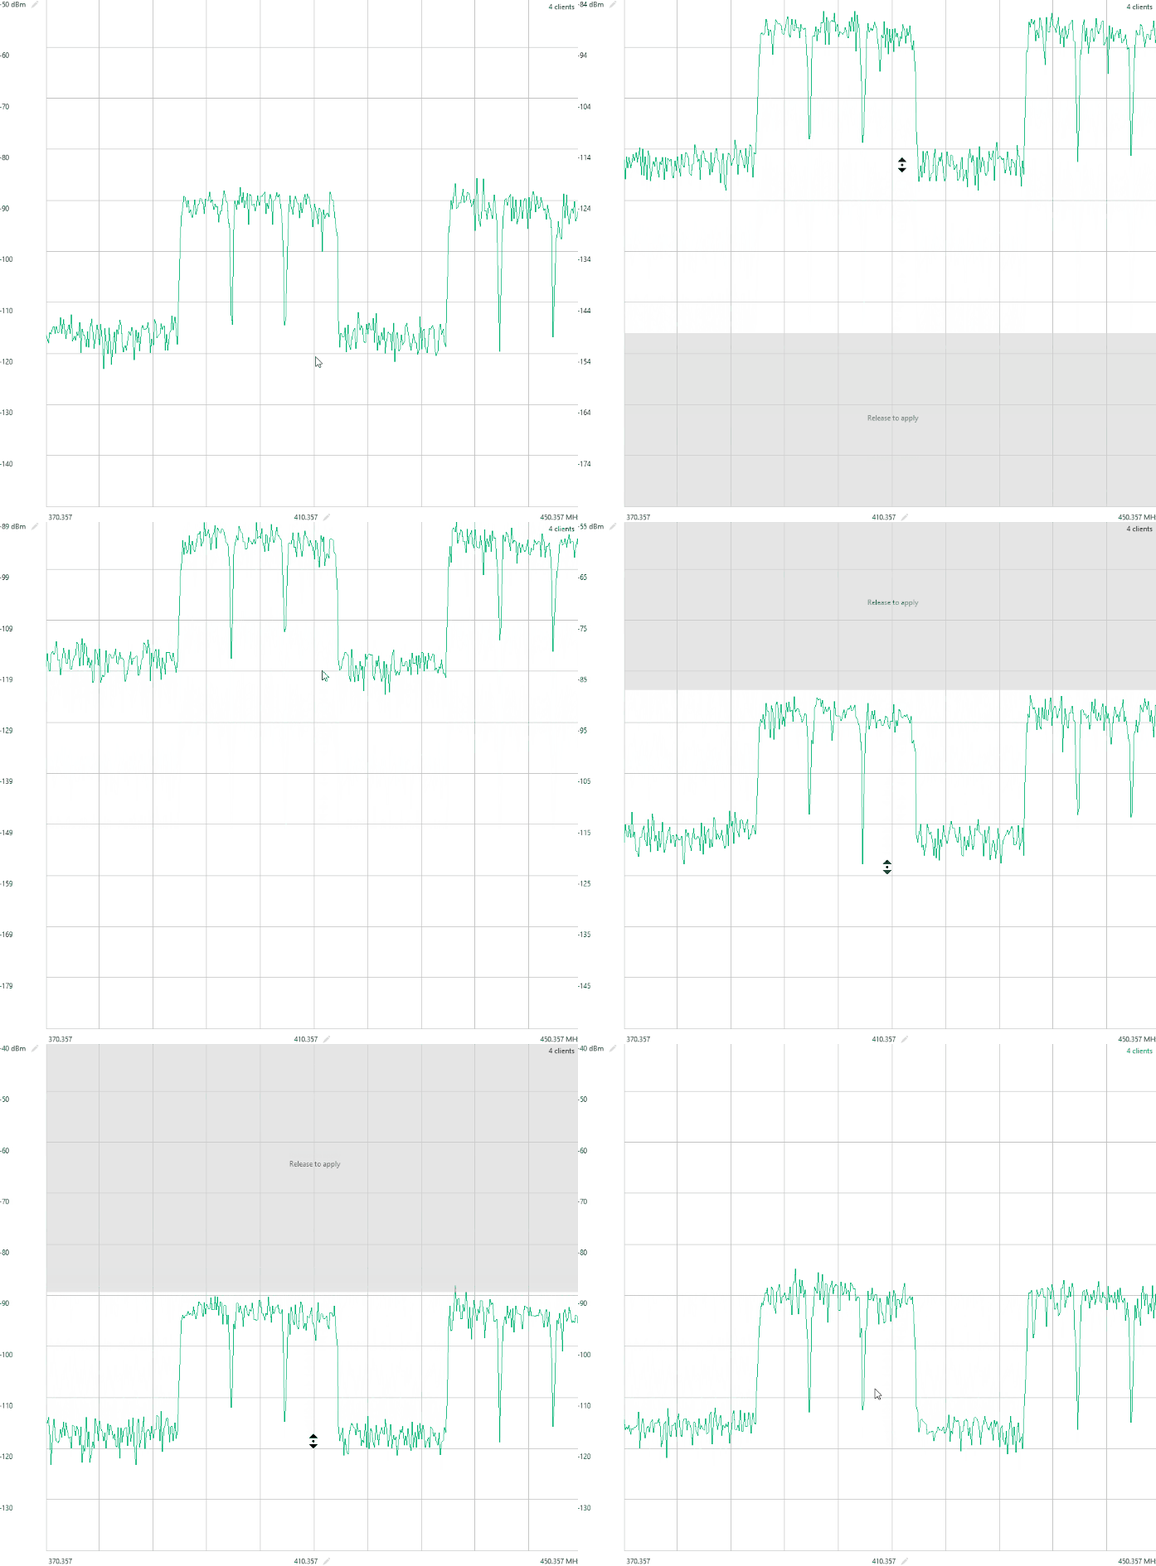
To pan vertically, click the trace and drag your mouse while keeping Ctrl pressed.

Spectrum analyzer trace in DataMiner 10.4.1The following will happen:
The trace moves up or down while being refreshed at a rate equal to the original rate.
The unknown part of the trace (i.e. the amplitude range located outside of the original span) is visualized as a gray area with a grid in the background.
The amplitude labels on the Y axis are updated continuously to reflect the ongoing change.
When you release the mouse button and Ctrl, the info pane to the right of the display section will automatically update with a reference level and amplitude scale that align with the new data. A new trace based on the updated reference level will now replace the gray area.
Note
Vertical panning is only available when the spectrum protocol includes the Reference level parameter.
Zooming is supported from DataMiner 10.2.0 [CU22]/10.3.0 [CU10]/10.4.1 onwards:
To zoom horizontally, scroll up and down. This has the same effect as altering the frequency span.
Note
Zooming horizontally is only possible if the spectrum protocol includes the Start frequency, Stop frequency, and Frequency span parameters.
To zoom vertically, scroll up and down while pressing the Ctrl key. This has the same effect as altering the amplitude scale.
Note
Zooming vertically is only possible if the spectrum protocol includes the Amplitude scale parameter.
From DataMiner 10.4.0 [CU14]/10.5.0 [CU2]/10.5.5 onwards, you can auto-scale the trace by clicking the  button next to the reference level Y-axis label in the real-time display section of the spectrum analyzer card. Clicking this button will maximize and center the current trace based on minimum and maximum values.
Note
The auto-scale option is only available when the spectrum protocol includes the Reference level and Amplitude scale parameters.
Displaying the minimum and maximum hold of the trace
It is possible to display the minimum and/or maximum hold of the trace you are currently viewing. To do so:
On the spectrum analyzer card, go to the trace tab.
In the Minimum hold or maximum hold section:
To show the minimum hold of the trace, click Show minimum.
To show the maximum hold of the trace, click Show maximum.
To reset the minimum hold, click Reset minimum.
To reset the maximum hold, click Reset maximum.
Note
Even when minimum and maximum hold are hidden, the calculation of the minimum and maximum hold continues. They are only reset when the reset option is clicked.
To modify the number of traces used for the minimum calculation, next to # traces minimum, select a different value in the drop-down list.
To modify the number of traces used for the maximum calculation, next to # traces maximum, select a different value in the drop-down list.
To display the minimum or maximum hold in a different color, in the Colors section, select a different color in the drop-down lists in question.
Note
When you are viewing multiple measurement points at the same time, these options are not available.
Displaying the average trace
It is possible to display the average trace, next to or instead of the actual real-time trace.
On the spectrum analyzer card, go to the trace tab.
In the section Average hold, select Show average.
If you want, you can then hide the actual real-time trace by clearing the selection from Show current in the Current section.
Customizing the average trace
To change the number of traces that is taken into account to calculate the average, next to # traces, select a different number of traces in the dropdown list.
By default, the number is set to inf, which means there is no limit to the number of traces taken into account.
To change the color of the average trace, in the Colors section, select a different color in the Average hold drop-down list.
Resetting the average calculation
In the trace tab, select Reset average.
Customizing the real-time display
Several options are available that allow you to customize the spectrum real-time display.
In the view tab of the ribbon, you can do the following:
To show or hide the info pane, select or clear the selection from Info pane.
To show or hide the grid lines, select or clear the selection from Grid lines.
To show or hide the grid labels at the edge of the real-time display, select or clear the selection from Grid labels.
To place the grid labels outside the edge of the grid, select External labels.
To change the size of the settings pane, drag the edge of the pane. Click the blue bar to the right of the pane to collapse or expand it entirely.
To change the units used in the real-time display, next to Amplitude units or frequency units, select a different unit in the drop-down list. Sweeptime units can also be customized.
The change of units will be applied everywhere on the spectrum analyzer card, including on the real-time display.
To change the number of decimals displayed for the frequency throughout the spectrum card, select the number of decimals in the Frequency decimals drop-down list. If you select Auto, the number of decimals for a particular parameter will depend on the value of the parameter.
To change the background color of the grid, in the Colors section, click Grid background and select a different color.
To change the color of the lines in the grid, in the Colors section, click Grid lines and select a different color.
To change the color of the text in the grid, e.g. the amplitude and frequency indicated along the axes, select Grid text and select a different color.
To view a square real-time display area, click Square view.
In addition, in the trace tab, you can do the following:
To change the color of the trace, in the Colors section, click Current trace and select a different color.
The color of the trace will also be indicated in a legend at the top of the info pane.
Viewing along with another client
When you work in real-time interactive mode, this requires part of the limited measuring capacity of the spectrum analyzer. As such, it can be useful to view along with another open client session instead of creating a session of your own.
To do so:
Go to the monitors tab of the ribbon and select View along.
Select the client you want to view along with and click OK.
In the middle of the display area, the name of the client will be displayed.
To stop viewing along, in the middle of the display area, click Exit.
Tip
See also: Watching spectrum buffers
Sharing spectrum sessions
It is possible for the same spectrum session to be shared, for instance when multiple users are viewing the same session at the same time, or when one user has multiple cards open showing the same spectrum session.
When session sharing is enabled, all cards showing the same spectrum session will show the same trace using the same settings. The fact that a shared session is being used will be shown in the info pane. If a user changes a setting (e.g. frequency, bandwidth, etc.), this change will immediately be applied to all other cards showing that same session.
Enabling shared session mode
To enable sharing of spectrum sessions for a spectrum element:
Either create the new spectrum element or edit the existing spectrum element. (See Adding elements or Updating elements, respectively.)
In the Advanced element settings section, select Shared session mode.
Click Apply.