Adding time-scoped related parameters to a trend graph
From DataMiner 10.3.8/10.4.0 onwards, a light bulb icon will be displayed when you select a time range on the trend graph of a parameter. If you want to know which other parameters are related to this parameter, based purely on the behavior during the selected time range, then you can click this icon to add or view related parameters. Even if multiple curves are displayed on the same trend graph, the light bulb always shows relations with one specific parameter, whose name is mentioned in the light bulb tooltip.
The feature proposes parameters from the same DataMiner service as well as the top parameters that are globally related. Prior to DataMiner 10.4.11/10.5.0, only parameters from the same DataMiner element are proposed. In DataMiner 10.4.11, parameters from other elements within the same service are also taken into account.
You can for instance use this in case a parameter (e.g. the total available memory of a server) behaves oddly during a particular time range (e.g. a downward spike), in order to find out if other parameters also showed unusual behavior during the same time range.
Prerequisites
The DataMiner System must use Storage as a Service (recommended) or a self-managed Cassandra-compatible database and indexing database.
Behavioral anomaly detection must be enabled. You can enable this feature in System Center, via System settings > analytics config.
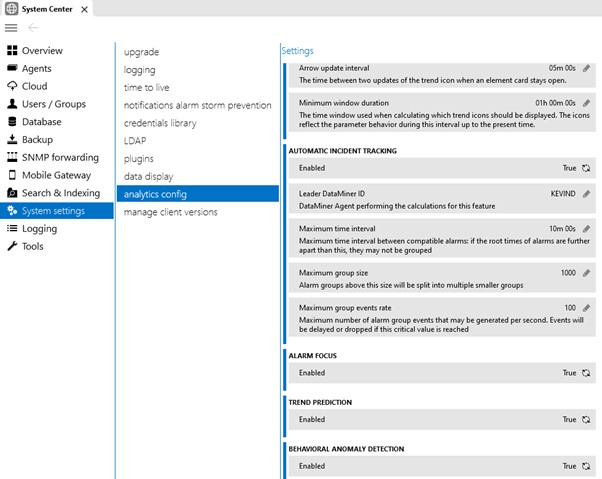
System Center analytics config page in DataMiner 10.3.5
Adding a time-scoped related parameter to a trend graph
To add a related parameter for a specific time range only:
In a trend graph showing trend information for one single parameter, select the section of the graph where the parameter shows the behavior you are interested in. The way you can do so depends on the configuration of the trending user settings. See Trending settings.
Click the light bulb icon. This will open a menu with the parameters related to your original parameter, but only taking into account the behavior within the selected time range.
Select the parameter you want to add.
If other related parameters are available that have not been added yet, you can click the light bulb again to add those parameters as well.
Note
The light bulb icon is always displayed regardless of whether DataMiner was able to find related parameters for the selected section. If no related parameters were found, the light bulb icon will not be "lit up" with an accent color as it would otherwise be. Click the icon for more information on why no related parameters could be found.