Working with trend predictions
Note
- This feature requires Storage as a Service (recommended) or a self-managed Cassandra-compatible database.
- Predictions are not available for discrete and string parameters.
- You can enable or disable this feature via System Center > System settings > analytics config. However, note that the feature needs to be enabled to receive automatic notifications for predicted alarm threshold breaches by Proactive cap detection.
Tip
For a how-to video, see Navigating Trending Graphs 
If the DataMiner Agent uses Storage as a Service or a self-managed Cassandra-compatible database, trend graphs can show how the value of a parameter in the graph is most likely to evolve in the future.
The current point in time is displayed with a vertical dashed line marked as "Now". This line is updated every 2 seconds. The trend prediction starts from the "Now" line.
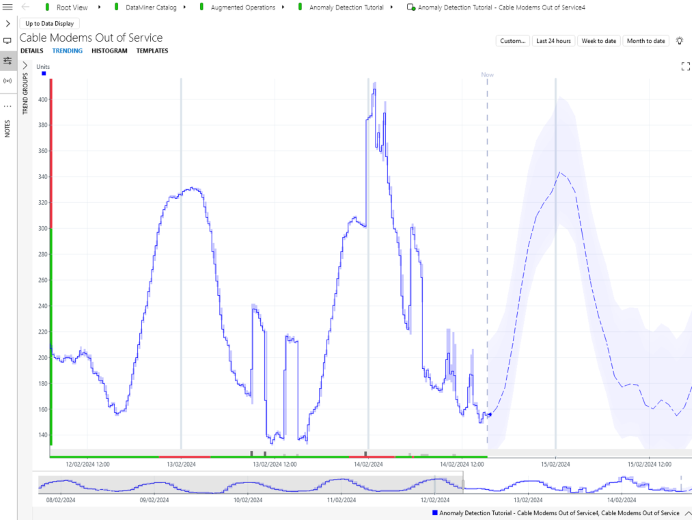
Trend graph in DataMiner 10.4.5
The predicted trend is displayed as a line surrounded by three shaded areas:
The largest shaded area shows how the parameter will evolve with 95 % probability
The middle area shows the evolution with 90 % probability, and
The smallest area shows the evolution with 80 % probability.
Note
- The predicted trend is generated by a machine learning model trained on the historical trend data of the metric.
- The probability percentages are based on the model made at the moment the graph is generated. If the behavior of the data changes afterwards, the probability may need to be adjusted.
Different types of trend prediction can be displayed, each in a different style.
High-precision prediction is displayed as a dotted line.
A high-precision prediction is generated by a model trained on the real-time trend data. This type of trend prediction offers the greatest level of detail but also has the shortest forecast time horizon.
Short-term prediction is displayed with short dashes.
A short-time prediction is generated by a model trained on the 5-minute averaged trend data. The use of 5-minute averages usually over extended time spans means that the forecast time horizon for a short-term prediction is typically longer compared to a high-precision prediction.
Mid-term prediction is displayed with long dashes.
A mid-term prediction is generated by a model trained on the 1-hour averaged trend data. This type of trend prediction offers a forecast time horizon that is typically longer compared to a short-term prediction.
Long-term prediction is displayed with slightly longer dashes.
A long-term prediction is generated by a model trained on an aggregated set of 1-hour trend data points. This type of trend prediction extrapolates the global trend in the data to the future.
Note
- The different prediction types correspond to the different time resolutions in the trend data logged by DataMiner.
- By having prediction models on different time resolutions, different trend data characteristics and patterns are captured.
To select which trend prediction type is used:
- From DataMiner 10.2.9/10.3.0 onwards, right-click the trend graph, select Trend prediction in the right-click menu, and then select the desired prediction type.
- In earlier DataMiner versions, use the drop-down list in the top-right corner.
You can either select one of the available trend prediction types, or select "Auto". Auto mode will automatically switch between the different trend prediction types as you zoom in and out on the graph.
From DataMiner 10.2.9/10.3.0 onwards, if one or more of the trend prediction types are not available, they will no longer appear in the right-click menu. In earlier DataMiner versions, a warning icon is displayed. If you hover over that icon, a tooltip will show which type or types cannot be displayed. If none of the trend prediction types are available, the tooltip will explain why.
In the DataMiner Cube user settings, the Trend prediction range setting determines whether the trend prediction range is by default set to "Auto" or if the range needs to be changed manually. See Trending settings.
Note
- It is possible that one or more prediction types might not be available for your metric. This occurs when there is an insufficient number of trend data points to build a reliable model or when the data behavior cannot be accurately captured by a prediction model.
- The first time the prediction exceeds a particular alarm threshold, this is indicated with a triangle-shaped marker. If multiple trends are displayed, you can hover over the alarm marker to see a tooltip indicating which trend will trigger the alarm.
- You can generate automatic alarm console notifications for these predicted alarm threshold breaches. See Proactive cap detection for more information.
- Parameter changes will change the underlying models for the prediction in real time, and predictions may change when the trend graph is shown at a later moment in time.
- When you change the prediction type to Auto, or change it from Auto to one of the other options, any other open trend charts will also be updated to that setting.
- The DataMiner process responsible for trend predictions is SLAnalytics. For more information, see SLAnalytics.