DataMiner Size tool
The DataMiner Size tool “WhatsTheSize.exe” queries an entire DataMiner System to count the number of metrics that are present in the system. This information will be used to determine the load on the system and allows us to give a better answer to the different capacity requirement questions we receive.
If you run this as a DataMiner user, do not hesitate to forward these results to our technical support team or your contact person. They will then will further process this information.
What’s included in the size check?
This will be counted:
Elements:
Normal elements
Aggregation data
Enhanced service data
SLA data
Parameters:
Single parameters
Cells in a table
The parameters that are added to an element by default
This will not be counted:
Elements:
- DVE child elements, as the data is part of the parent element
Parameters:
- View tables, as they reference data from other elements
Running the DataMiner Size tool
To run this tool, follow the procedure below. The letters in parentheses refer to the images below the procedure.
Extract the zip file on a computer that has access to a node of your DataMiner System.
Run the tool by double-clicking WhatsTheSize.exe.
Note
On systems that have not been updated since July 2020, a pop-up message may be displayed that says the tool is not licensed. You can close this pop-up window, as the tool will work regardless. If the pop-window is displayed again, which may occur now and then, close it again, as the tool cannot continue counting as long as the pop-up window is displayed.
In the Server field (a), specify the IP or name of a DataMiner node.
In the User name and Password field (b), specify the credentials of an account that has access to the DMS. If you are running the tool using an account that has access to the DMS, you do not need to fill these in.
Note
The tool only counts the elements that you have access to with the user credentials you are using. If you want to count your entire setup, make sure you use user credentials with sufficient rights to access all elements in the DMS.
Click the Connect button (d).
Note
If you encounter a
Skyline.DataMiner.Net.Exceptions.DataMinerCommunicationException:Possible version conflictexception, copy the SLNetTypes.dll and ICSharpCode.SharpZipLib.dll files fromC:\Skyline DataMiner\Filesto the directory where the WhatsTheSize.exe file is located.Optionally, specify (part of) a protocol or element name in the Filter box (c) in case you only want to count specific protocols or elements. Only protocols or elements that contain the text specified in the box (case-insensitive) will be taken into account.
For example, if your filter is “ird”, only elements with “ird” in the element name or protocol name will be included.
Click the Scan button (e).
Wait until the program is finished. During the scan, you will see:
How many elements have been scanned and the total number of elements to scan (f)
The progress within the current element (g)
The total time the scan has taken up to now (h)
For every element that is scanned (i):
The number of metrics
The number of monitored and trended parameters
When the tool is finished, you will see:
The tool disconnecting from your DMS (j)
How long the scan took (k)
The total number of metrics counted (l)
The path where the output file is stored (m) and a link to that file (n)
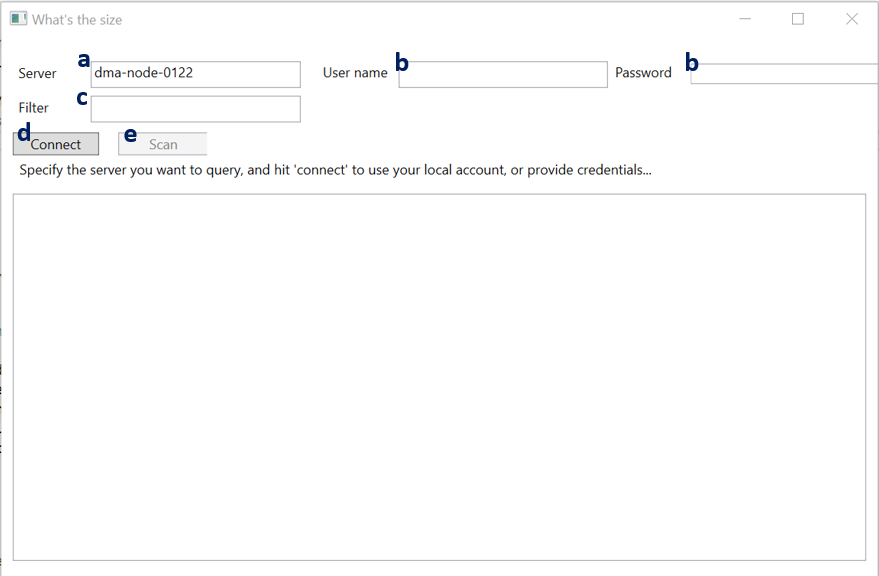
DataMiner Size tool: Initial window to start scanning
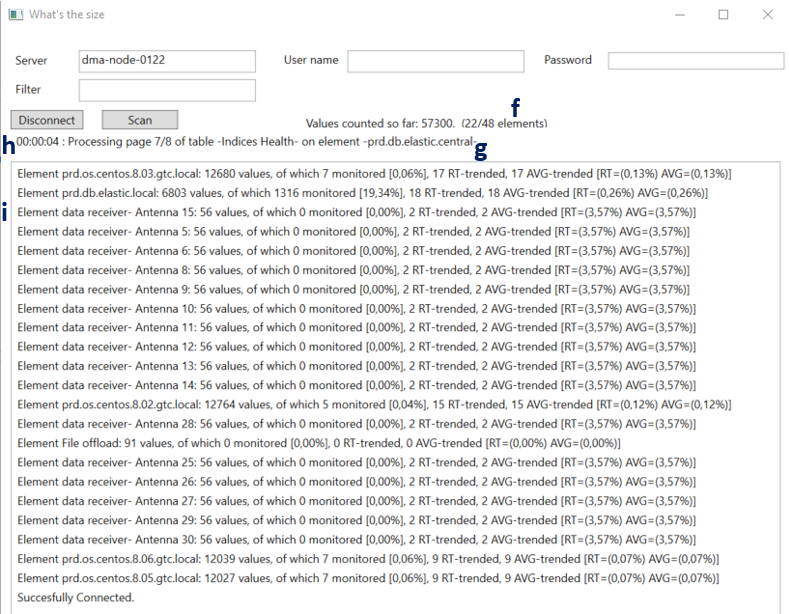
DataMiner Size tool: During the scan
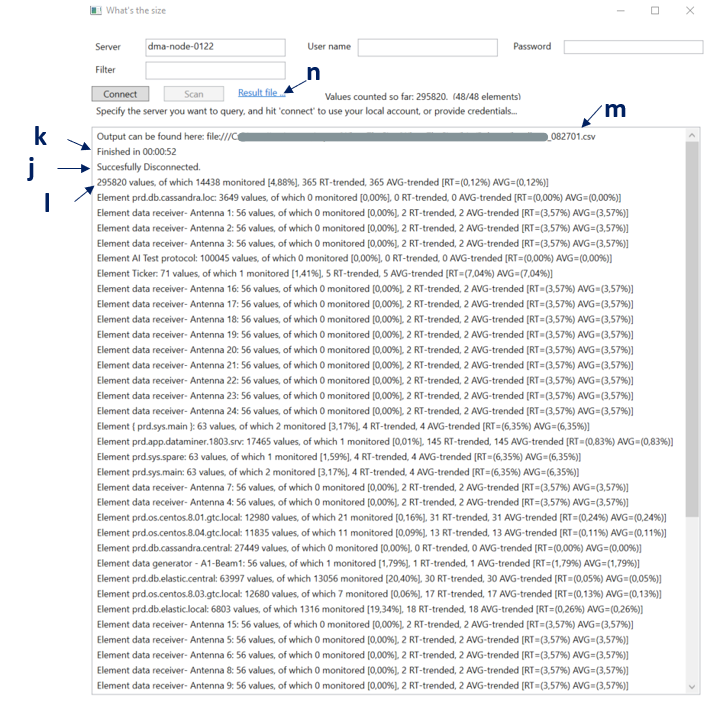
DataMiner Size Tool: After the scan
Output file columns
The output file has the following columns:
Hosting DMA: The DMA hosting the element.
DMAID/ElementID: The DMA ID and element ID of the element.
Element Name: The name of the element.
Protocol Name: The name of the protocol used by the element.
Protocol Version: The version of the protocol used by the element.
# of metrics: The sum of all single parameters and cells of the element.
# of rows: The number of rows found in the tables of the element.
# of RT trended: The number of real-time trended values (of single parameters and cells) of the element.
# of AVG trended: The number of average trended values (of single parameters and cells) of the element.
max trended: The total number of values in the element that can be trended.
% RT trended metrics: The number of real-time trended values divided by the number of all single parameters and cells of the element (i.e. # of RT trended divided by # of metrics).
% AVG trended metrics: The number of average trended values divided by the number of all single parameters and cells of the element (i.e. # of AVG trended divided by # of metrics).
# of monitored: The number of monitored values (of single parameters and cells) of the element.
Max monitored: The total number of values of the element that can be monitored.
% monitored metrics: The number of monitored values divided by the number of all single parameters and cells of the element (i.e. # of monitored divided by # of metrics).