DataMiner Health Check Tool dashboards
The DataMiner Health Check Tool features two dashboards designed to help you monitor the overall status of your DataMiner System and review the results of executed tests. When you have deployed the tool, you will be able to find these dashboards in the DataMiner Health Check folder in the Dashboards app.
Health Check Overview dashboard
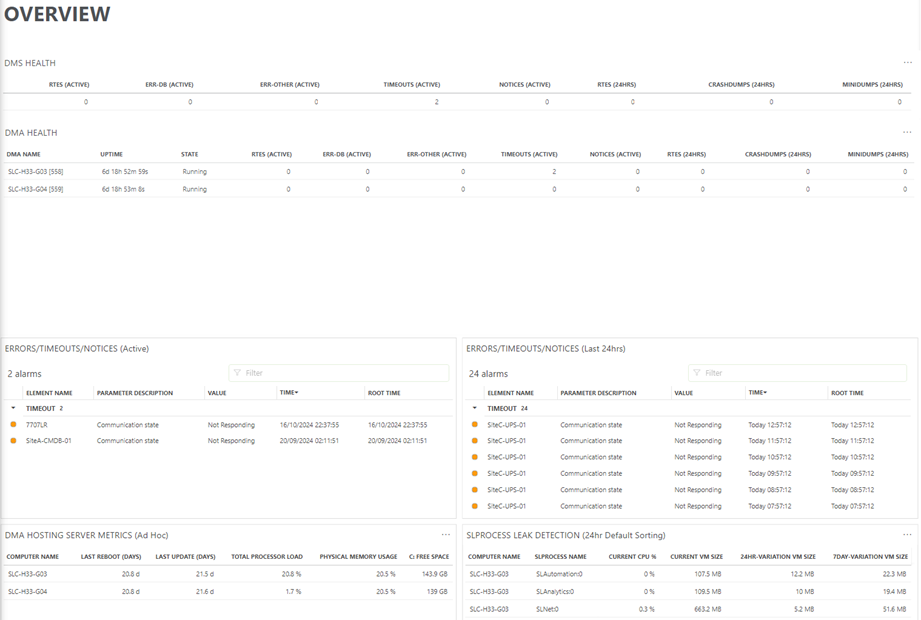
This dashboard provides a comprehensive monitoring interface for your DataMiner System. You can view critical indicators including active RTEs, database errors (ERR-DB), timeouts, and system notices.
The dashboard is organized into two main sections:
- The top section combines a DMS and DMA health summary with an active error/timeout monitoring panel, allowing quick identification of immediate system issues.
- The lower section presents crucial server performance metrics, including processor load, memory usage, and available disk space, complemented by a process leak detection panel that monitors VM size variations over time.

Health Check Results dashboard
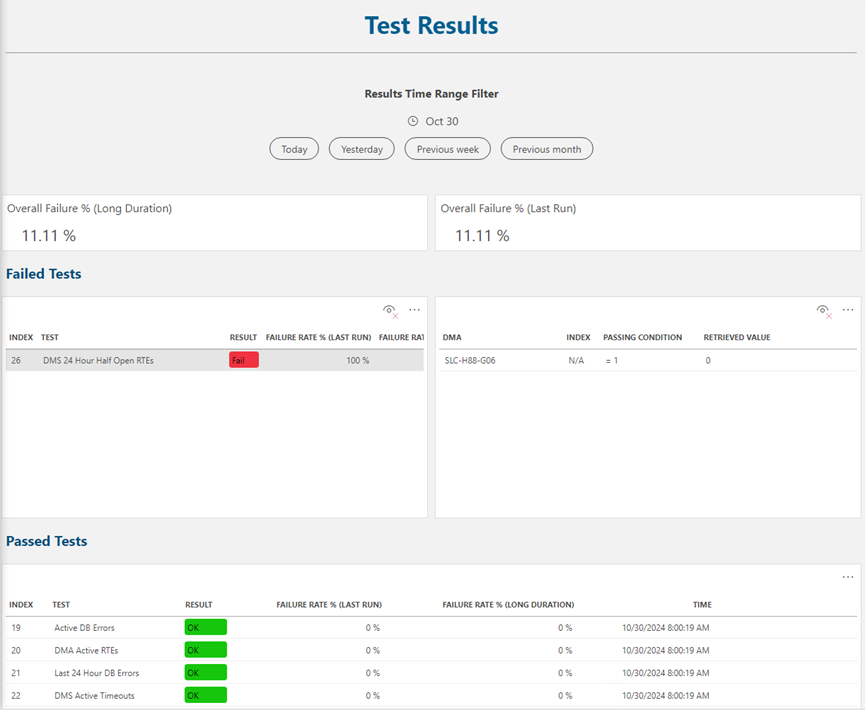
The Test Results dashboard provides an overview of tests defined in the Health Check Manager element, displaying both successful and failed test outcomes. At the top, a time range filter allows you to view results for different periods – including today, yesterday, previous week, or previous month – helping you track system performance over time.
The dashboard presents two key metrics prominently:
- Overall Failure % (Long Duration): Shows the cumulative failure rate over the selected time.
- Overall Failure % (Last Run): Displays the most recent test execution results
The main interface is organized into two detailed sections:
- Failed Tests: Highlights tests that did not pass, showing information such as failure rates and timestamps. Clicking a failed test reveals additional details in an adjacent panel.
- Passed Tests: Lists successfully completed tests with their results, failure rates (both last run and long duration), and execution timestamps.
