Protocol debug tools
This tool can be helpful to debug issues in specific protocols. It can visualize foreign key and view table relations. You can also use it to build a modified version of a protocol where all data is editable, so that you do not need an actual device to debug issues.
You can download this tool from DataMiner Dojo.
Usage
To use this tool:
Extract the zip file you downloaded using the button above in a local folder on a DataMiner Agent running the protocol you want to debug.
Double-click ProtocolDebugTools.exe.
Specify a user and password and click Connect.
In the Protocol drop-down box, select the protocol and version.
At this point, multiple features are available for the debugging of the selected protocol.
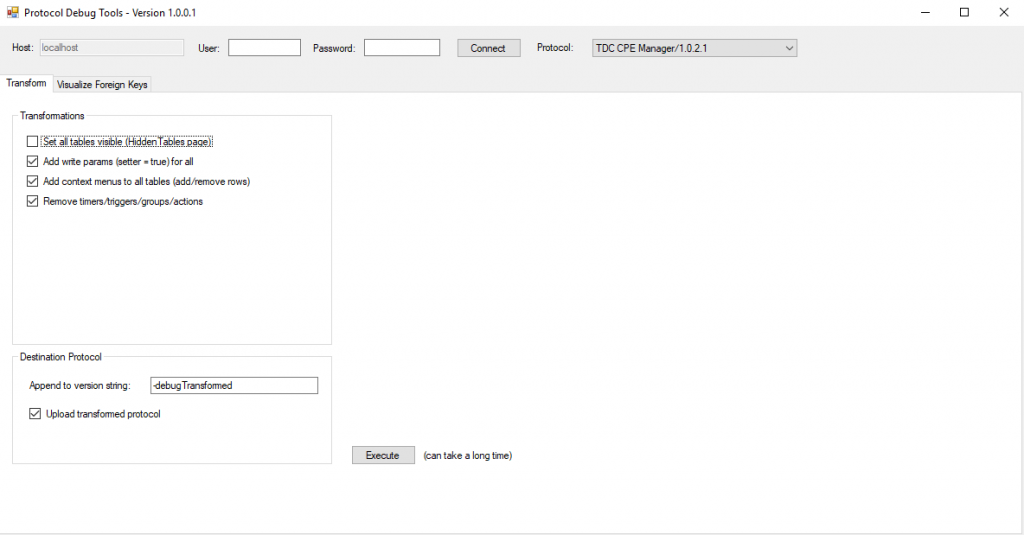
In the Transform tab, the following options allow you to configure a modified Protocol.xml for debugging:
Set all tables visible (Hidden Tables page): Select this option to display all hidden tables on a Hidden Tables page in the modified protocol.
Add write params (setter = true) for all: Select this option to make it possible to set a value for all parameters, including parameters that are read-only in the original protocol.
Add context menus to all tables (add/remove rows): Select this option to add context menu options to add or remove rows to all tables.
Remove timers/triggers/groups/actions: Select this option to remove timers, triggers, groups and actions from the modified protocol.
Append to version string: Determines which suffix will be added to the modified protocol to distinguish it from the original protocol.
Upload transformed protocol: Select this option to upload the modified protocol version to the DMA.
You can then generate the modified Protocol.xml by clicking the Execute button below these options.
In the Visualize Foreign Keys tab, the buttons at the top allow you to view the structure of the protocol:
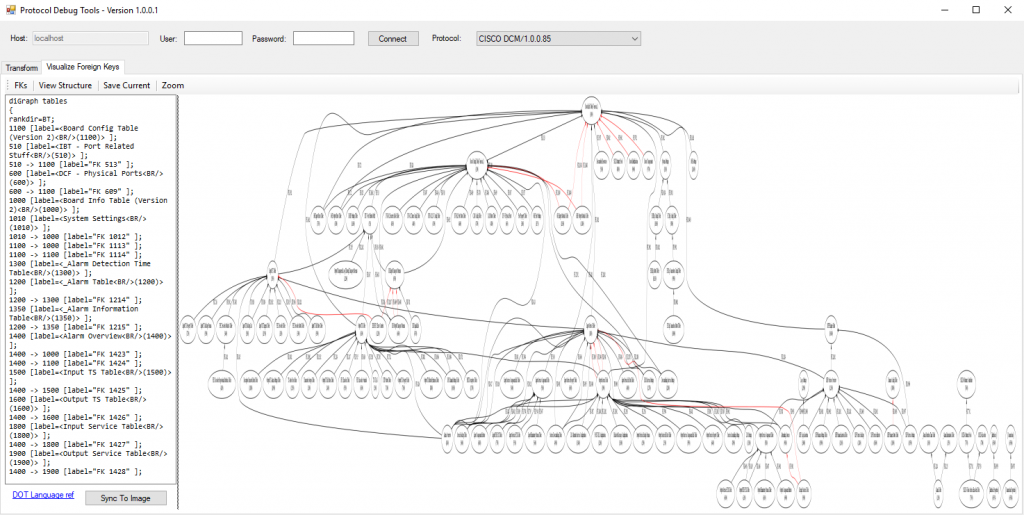
FKs: Visualizes the foreign key relations in the protocol. A text box on the left allows you to remove tables you do not want to see.
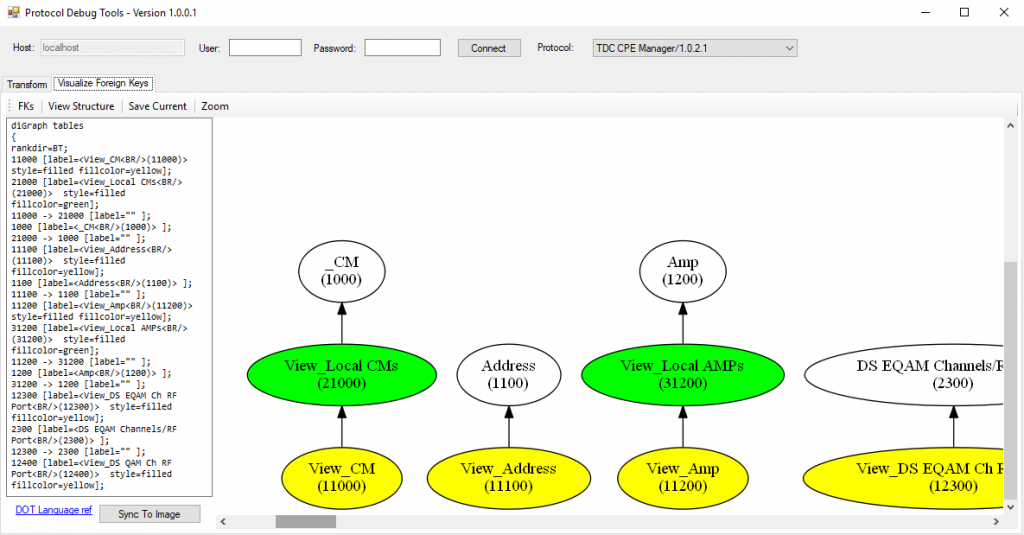
View Structure: Displays the view structure of the protocol. Direct view tables are displayed in yellow; views are displayed in green.
Save Current: Saves the currently displayed image on the disk.
Zoom: Toggles between the complete image and a version that is resized to fit in the window.
Examples
Clicking the Execute button with the configuration below will add a protocol “TDC CPE Manager/1.0.2.1-debugTransformed” on the DMA.
In the example below, you can see the visualization of the foreign keys of a protocol, with the text box on the left that can be used to remove tables that should not be included:
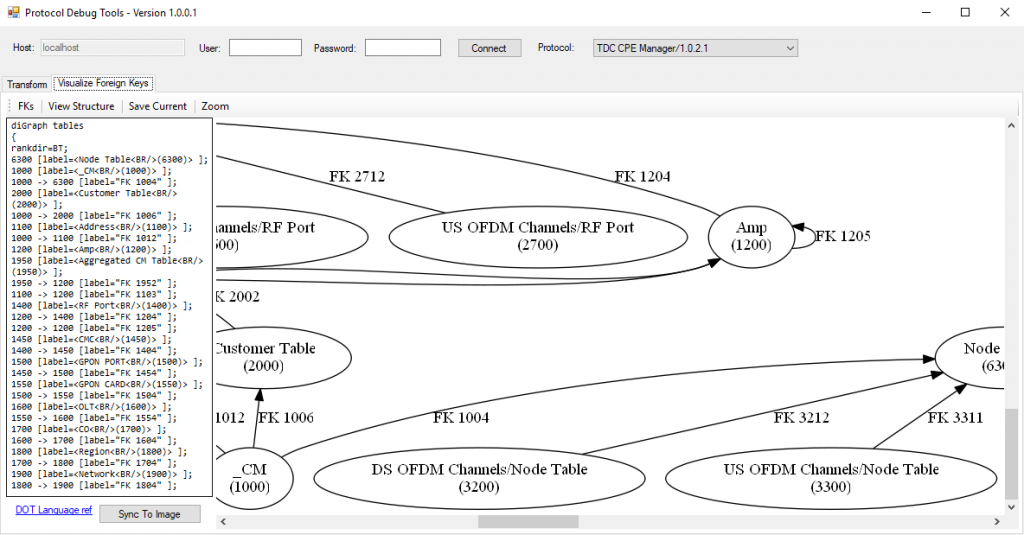
In the example below, red lines show foreign key relations that are not explicitly mentioned in the relations defined in the protocol:
The example below shows how the view structure is visualized, with direct view tables indicated in yellow and views indicated in green: