Watchdog logging
About SLWatchdog
The SLWatchdog process monitors all other DataMiner processes and takes action when a DataMiner process disappears from the list of running processes, or when an anomaly is detected in a DataMiner process. It also keeps track of a number of key performance indicators.
Caution
SLWatchdog must never be started or restarted manually when DataMiner is running. Doing so may have unintended consequences as it guards the DataMiner processes.
Watchdog log entries
In the Watchdog logging, you will find an overview of all threads used by a DataMiner Agent. Since DataMiner elements use a protocol thread, starting or stopping an element will also be registered in the Watchdog logging.
For example, when an element is started, you will find a log line like this:
2021-02-26 11:13:17 27664|Add Thread (57635) SLProtocol.exe - [Miteq UPB1-XTR/1.0.0.1] Miteq UPB1 UC - ProtocolThread [element 101/191] (time = 00:07:30)
When an element is stopped, you will find a log line like this:
2021-02-26 11:13:17 27664|(57635) Stopped [Miteq UPB1-XTR/1.0.0.1] Miteq UPB1 UC - ProtocolThread from SLProtocol.exe
Run-time errors
When a thread is added, a time value is added to the log line in parentheses. This time value indicates how long the SLWatchdog process will wait in case the thread is not responding. In the example for the started element above, this is 7 and a half minutes. After this time has elapsed, SLWatchdog will log a half-open run-time error.
A half-open RTE logged by SLWatchdog can for instance look like this:
2021-02-22 12:48:58 8260|- (478) Not signaled 1 (since 2021-02-22 12:39:22): SLProtocol.exe - [Miteq UPB1-XTR/1.0.0.1] Miteq UPB1 UC - ProtocolThread
2021-02-22 12:48:58 8260|HALFOPEN RTE: - (478) Not signaled 1 (since 2021-02-22 12:39:22): SLProtocol.exe - [Miteq UPB1-XTR/1.0.0.1] Miteq UPB1 UC - ProtocolThread in Process: SLProtocol.exe for Thread: [Miteq UPB1-XTR/1.0.0.1] Miteq UPB1 UC - ProtocolThread notificationID created: 10753
If the time in parentheses has elapsed twice, a full run-time error is triggered, which is indicated with an alarm in the Alarm Console in DataMiner Cube. In the example for the element above, this will occur after 15 minutes (i.e. twice 7:30 minutes).
An RTE logged by SLWatchdog can for instance look like this:
2021-02-27 07:48:39 8260|>>>>>>> (320) THREAD PROBLEM : SLDMS.exe - NotificationThread
2021-02-27 07:48:39 8260|Send alarm for process SLDMS.exe (bSignaled = FALSE, bStopped = FALSE) for iCookie = 320 (RTE Count = 1)
2021-02-27 07:48:39 8260|** Making minidump ..
2021-02-27 07:48:48 8260|** Making minidump C:\Skyline DataMiner\Logging\MiniDump\2018_02_27 07_48_39_SLDMS.exe.zip finished.
2021-02-27 07:48:48 8260|OPEN RTE: Runtime error in process SLDMS.exe on agent MIEKED2 in Process: SLDMS.exe for Thread: NotificationThread with notificationID: 11395
The "RTE Count" you can see in the example above refers to the number of processes with a distinct name that have an RTE. This counter will only increase when a process with a different name also has an RTE. If, for example, there are 5 SLProtocol processes with an RTE, the RTE Count is 1. However, if SLElement were to have an RTE as well, the RTE Count would increase to 2. The RTE Count will only go back to 0 when all threads are OK again and all processes are working as expected.
Accessing Watchdog logging
There are two ways to access the Watchdog logging:
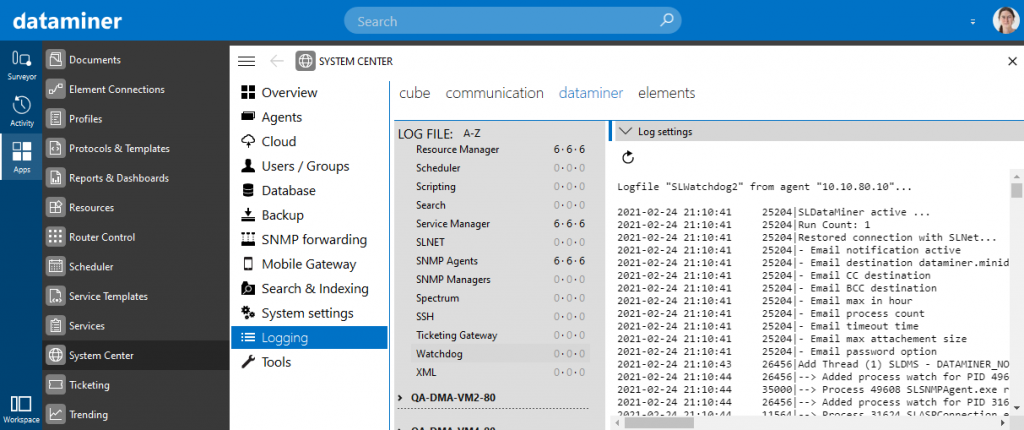
- In DataMiner Cube, go to System Center > Logging > DataMiner, select the DMA for which you want to see the logging, and select Watchdog in the list of files on the left.
- On the DMA, go to the folder
C:\Skyline DataMiner\Loggingand open the SLWatchdog2.txt file.

Watchdog logging in DataMiner Cube (version 10.1.0)