Investigating exception occurrence on Finalizer thread
This section illustrates how to investigate a crash of the SLScripting process in case an exception occurred on the Finalizer thread.
A finalizer can be used to perform cleanup when the class instance is being collected by the garbage collector. Instances of a class that contain a Finalizer get added to the Finalize queue, which then get processed by the Finalizer thread. It is important to make sure that the Finalizer does not throw an exception, as this results in a process crash when the Finalizer thread is executing the Finalizer method of the type that is being freed.
Note
- Typically, you can avoid having to provide a finalizer by using the SafeHandle or derived classes to wrap any unmanaged handle.
- We recommend providing a way to explicitly release resources before the garbage collector frees the object by implementing the IDisposable interface to perform the necessary cleanup for the object. This can considerably improve the performance of the application. Note, however, that even if you implement IDisposable, the finalizer acts as a safeguard to clean up the resources if the call to the Dispose method fails.
Tip
For more information about cleaning up resources, refer to:
Investigating the crash dump in Visual Studio
In case a crash occurs because of an exception in the Finalize method of a class instance, a dump of SLManagedScripting is created. The ERRORLOG.TXT file should contain an indication of this exception. For example:
System.NullReferenceException: Object reference not set to an instance of an object.
   at Skyline.Protocol.MyExtension.MyClass.Finalize()
To investigate the crash dump:
Open the SLManagedScripting dump file in Visual Studio, and click the Run Diagnostic Analysis link in the Actions list.
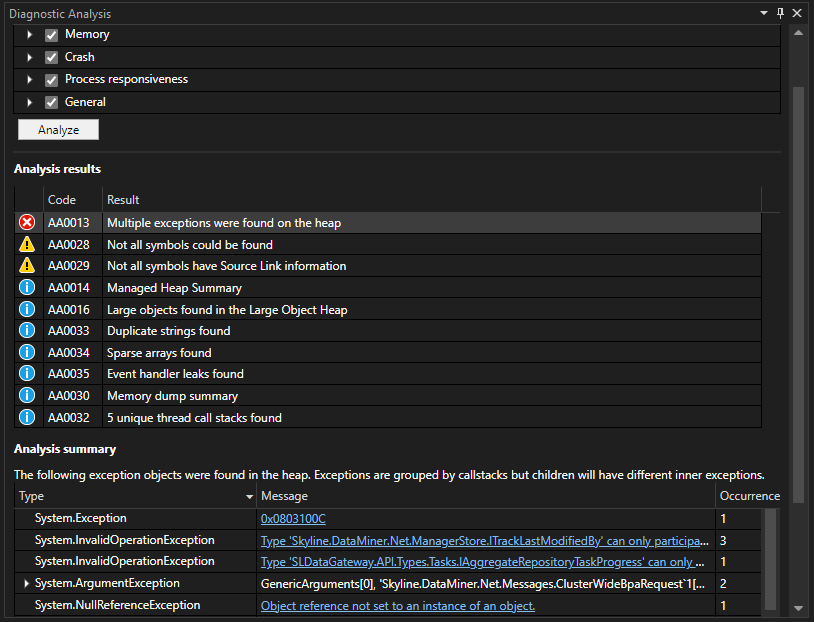
The Analysis results pane should show that an exception was found on the heap:

Visual Studio Analysis resultsIn this case, it mentions that a NullReferenceException was found.
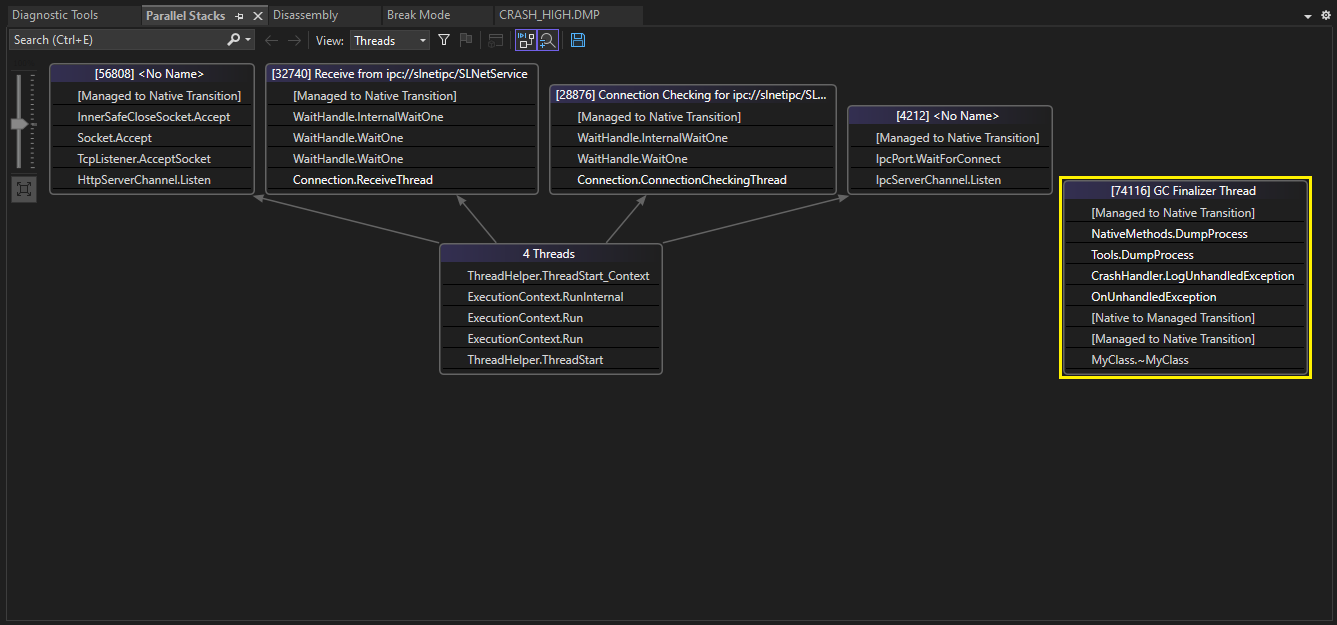
Open the Parallel Stacks window (Debug > Windows > Parallel Stacks):

Visual Studio Parallel Stacks windowThis shows that an unhandled exception occurred on the Finalizer thread (
OnUnhandledException) while executing the Finalizer of MyClass (~MyClass).Inspect the source of the class to find out why the exception was thrown.
Investigating the crash dump with WinDbg
Open the dump file with WinDbg (File > Open Dump File).
Tip
Once the dump file is opened, you can try executing the .lastevent and !analyze commands to see if these show some relevant information. Note that these commands might not always provide additional info.
Approach 1: Finding the assembly via the !name2ee command
List all the managed threads by using the
!threadscommand:!threads ThreadCount: 36 UnstartedThread: 0 BackgroundThread: 15 PendingThread: 0 DeadThread: 19 Hosted Runtime: no Lock ID OSID ThreadOBJ State GC Mode GC Alloc Context Domain Count Apt Exception 3 2 12184 053b3510 2b220 Preemptive 145509A8:00000000 053a1b50 0 MTA (Finalizer) System.NullReferenceException 144d100c 4 9 c39c 0a4da900 102a220 Preemptive 00000000:00000000 053a1b50 0 MTA (Threadpool Worker) 6 8 ec30 0abe7dd0 1020220 Preemptive 00000000:00000000 053a1b50 0 Ukn (Threadpool Worker) 7 10 dde8 0abe8318 2b220 Preemptive 00000000:00000000 053a1b50 0 MTA 8 1 1074 0abe8860 2b220 Preemptive 00000000:00000000 053a1b50 0 MTA 9 23 70cc 0abe7888 202b020 Preemptive 00000000:00000000 053a1b50 0 MTA 10 24 7fe4 0abea810 202b020 Preemptive 14533158:00000000 053a1b50 0 MTA 12 109 ecd0 0abcdae8 1029220 Preemptive 00000000:00000000 053a1b50 0 MTA (Threadpool Worker) XXXX 70 0 0abce030 30820 Preemptive 00000000:00000000 053a1b50 0 Ukn XXXX 35 0 0abd6c48 30820 Preemptive 00000000:00000000 053a1b50 0 Ukn 13 42 b6ac 0ac22ee0 20220 Preemptive 00000000:00000000 053a1b50 0 Ukn XXXX 91 0 1555e818 39820 Preemptive 00000000:00000000 053a1b50 0 Ukn XXXX 68 0 0f31f408 39820 Preemptive 00000000:00000000 053a1b50 0 Ukn XXXX 27 0 1554fca0 39820 Preemptive 00000000:00000000 053a1b50 0 Ukn XXXX 96 0 0ac219c0 39820 Preemptive 00000000:00000000 053a1b50 0 Ukn XXXX 111 0 0ac213d0 39820 Preemptive 00000000:00000000 053a1b50 0 Ukn XXXX 101 0 0ac1f968 39820 Preemptive 00000000:00000000 053a1b50 0 Ukn XXXX 22 0 155501e8 39820 Preemptive 00000000:00000000 053a1b50 0 Ukn XXXX 31 0 15550730 39820 Preemptive 00000000:00000000 053a1b50 0 Ukn XXXX 49 0 0ac203f8 39820 Preemptive 00000000:00000000 053a1b50 0 Ukn XXXX 6 0 0ac1e448 39820 Preemptive 00000000:00000000 053a1b50 0 Ukn XXXX 17 0 0f31f950 39820 Preemptive 00000000:00000000 053a1b50 0 Ukn XXXX 54 0 0abe7340 39820 Preemptive 00000000:00000000 053a1b50 0 Ukn XXXX 50 0 0abed798 39820 Preemptive 00000000:00000000 053a1b50 0 Ukn 18 52 157f0 0abe92f0 1029220 Preemptive 00000000:00000000 053a1b50 0 MTA (Threadpool Worker) 19 15 4dcc 0f31ff40 1029220 Preemptive 00000000:00000000 053a1b50 0 MTA (Threadpool Worker) 20 86 b188 0abedce0 1029220 Preemptive 00000000:00000000 053a1b50 0 MTA (Threadpool Worker) 21 56 146d0 0abce578 1029220 Preemptive 00000000:00000000 053a1b50 0 MTA (Threadpool Worker) 22 74 12e58 0a46f1c8 1029220 Preemptive 00000000:00000000 053a1b50 0 MTA (Threadpool Worker) 23 93 f7c8 0a4716c0 1029220 Preemptive 00000000:00000000 053a1b50 0 MTA (Threadpool Worker) XXXX 114 0 0a471178 39820 Preemptive 00000000:00000000 053a1b50 0 Ukn 24 61 cc58 0ac1df00 8029220 Preemptive 00000000:00000000 053a1b50 0 MTA (Threadpool Completion Port) XXXX 113 0 0a46e1f0 39820 Preemptive 00000000:00000000 053a1b50 0 Ukn XXXX 80 0 15551708 39820 Preemptive 00000000:00000000 053a1b50 0 Ukn 25 81 186c 0abecd08 8029220 Preemptive 00000000:00000000 053a1b50 0 MTA (Threadpool Completion Port) XXXX 46 0 15550c78 39820 Preemptive 00000000:00000000 053a1b50 0 UknHere, the first line indicates that a System.NullReferenceException occurred on the Finalizer thread.
Switch to the Finalizer thread.
Switch to this thread by using the
~3scommand (3 is the value for the thread in the first column of the!threadscommand output).Execute the
!clrstackcommand.0:003> !clrstack OS Thread Id: 0x12184 (3) Child SP IP Call Site 0a14e91c 773d3f3c [InlinedCallFrame: 0a14e91c] 0a14e918 0ce2221e DomainBoundILStubClass.IL_STUB_PInvoke(IntPtr, UInt32, System.Runtime.InteropServices.SafeHandle, MINIDUMP_TYPE, IntPtr, IntPtr, IntPtr) 0a14e91c 0ce22146 [InlinedCallFrame: 0a14e91c] Skyline.DataMiner.Net.Tools+NativeMethods.MiniDumpWriteDump(IntPtr, UInt32, System.Runtime.InteropServices.SafeHandle, MINIDUMP_TYPE, IntPtr, IntPtr, IntPtr) 0a14e980 0ce22146 Skyline.DataMiner.Net.Tools+NativeMethods.DumpProcess(System.String, Boolean) 0a14e9b4 0ce22081 Skyline.DataMiner.Net.Tools.DumpProcess(System.String) 0a14e9d8 0ce2159d Skyline.DataMiner.Net.ToolsSpace.CrashHandler.LogUnhandledException(System.String, System.Exception, Boolean) 0a14ea30 0ce2095b .OnUnhandledException(System.Object, System.UnhandledExceptionEventArgs) 0a14eb9c 74922536 [GCFrame: 0a14eb9c] 0a14ec48 74922536 [GCFrame: 0a14ec48] 0a14ecf4 74922536 [GCFrame: 0a14ecf4] 0a14ee14 74922536 [GCFrame: 0a14ee14] 0a14f7d0 74922536 [DebuggerU2MCatchHandlerFrame: 0a14f7d0] 0a14f5c4 0ce20856 Skyline.Protocol.MyExtension.MyClass.Finalize() 0a14f7d0 7496c971 [DebuggerU2MCatchHandlerFrame: 0a14f7d0]The stack shows that an unhandled exception occurred while executing the Finalizer of the
Skyline.Protocol.MyExtension.MyClasstype.Determine the assembly this type belongs to (and therefore the connector), by executing the following command:
!name2ee * Skyline.Protocol.MyExtension.MyClass.-------------------------------------- Module: 0ce00a14 Assembly: SLC-C-SLProtocolNew.1.0.0.1.QAction.5, Version=1.0.0.0, Culture=neutral, PublicKeyToken=null -------------------------------------- Module: 0ce01a04 Assembly: ExampleProtocol.1.0.0.1.QAction.1, Version=1.0.0.0, Culture=neutral, PublicKeyToken=null Token: 02000002 MethodTable: 0ce02f2c EEClass: 0da35d64 Name: Skyline.Protocol.MyExtension.MyClass -------------------------------------- Module: 0ce01dbc Assembly: ExampleProtocol.1.0.0.1.QAction.900012, Version=1.0.0.0, Culture=neutral, PublicKeyToken=null -------------------------------------- Module: 0ce021e8 Assembly: ExampleProtocol.1.0.0.1.QAction.2, Version=1.0.0.0, Culture=neutral, PublicKeyToken=null --------------------------------------The output lists all the assemblies, and for each assembly that defines this type, the type is mentioned. In this case, you can see that the assembly
ExampleProtocol.1.0.0.1.QAction.1defines a typeSkyline.Protocol.MyExtension.MyClass, so you should inspect the Finalizer of theMyClasstype defined in QAction 1 of theExampleProtocolconnector version1.0.0.1.Inspect the source of the class to find out why the exception was thrown:
In WinDbg, you can use the
!dumpclasscommand to retrieve more information about the type using its EEClass value as argument:!dumpclass 0da35d64.0:003> !dumpclass 0da35d64 Class Name: Skyline.Protocol.MyExtension.MyClass mdToken: 02000002 File: ExampleProtocol.1.0.0.1.QAction.1, Version=1.0.0.0, Culture=neutral, PublicKeyToken=null Parent Class: 72dc6118 Module: 0ce01a04 Method Table: 0ce02f2c Vtable Slots: 4 Total Method Slots: 5 Class Attributes: 100001 Transparency: Critical NumInstanceFields: 0 NumStaticFields: 0Use the
!dumpmt -md 0ce02f2ccommand (where 0ce02f2c is the Method Table address of the type as seen from the output of the!dumpclasscommand) to see the methods this type defines:0:003> !dumpmt -md 0ce02f2c EEClass: 0da35d64 Module: 0ce01a04 Name: Skyline.Protocol.MyExtension.MyClass mdToken: 02000002 File: ExampleProtocol.1.0.0.1.QAction.1, Version=1.0.0.0, Culture=neutral, PublicKeyToken=null BaseSize: 0xc ComponentSize: 0x0 Slots in VTable: 6 Number of IFaces in IFaceMap: 0 -------------------------------------- MethodDesc Table Entry MethodDe JIT Name 731a9a58 72dc9e9c PreJIT System.Object.ToString() 7326a370 72f261d8 PreJIT System.Object.Equals(System.Object) 73198e60 72f261f8 PreJIT System.Object.GetHashCode() 0ce20840 0ce02f08 JIT Skyline.Protocol.MyExtension.MyClass.Finalize() 0d37de08 0ce02f18 NONE Skyline.Protocol.MyExtension.MyClass..ctor() 0ce20820 0ce02efc JIT Skyline.Protocol.MyExtension.MyClass.PerformAction()To see the IL code of the Finalize method, use the
!u 0ce02f08command (where0ce02f08is the address denoted for theFinalizemethod in the output of the!dumpmtcommand).
Approach 2: Finding the assembly via the !eestack command
Another approach to find the type and file that defines the method where the exception occurred is to use the !eestack command. The following steps illustrate how to do this with another example where an exception occurs in the Finalizer thread.
Like in the previous section, use the
!threadscommand to list all the managed threads.Show stacks using the
!eestackcommand.If you see that an exception occurred on the Finalizer thread, you can use the
!eestackcommand to list the call stacks.The output for the Finalizer thread might show an exception, and just below the exception you might find more info on what Finalize method was being executed (in the output, look at the output for Thread X, where X denotes the number for the Finalizer thread as seen in the output of the
!threadscommand, which is 3 in this case.):... --------------------------------------------- Thread 3 .... 00000000 00004015 00004015 ====> Exception cxr@0a05f680 0a05fb18 0fbdc482 (MethodDesc 0b51b8bc +0x12 Skyline.DataMiner.Scripting.ConcreteSLProtocol.Log(System.String, Skyline.DataMiner.Scripting.LogType, Skyline.DataMiner.Scripting.LogLevel)) 0a05fb28 0f25ea3e (MethodDesc 15633010 +0x4e QAction.Dispose()), calling 0ae63e7e 0a05fb30 0f25ea55 (MethodDesc 15633010 +0x65 QAction.Dispose()), calling clr!JIT_WriteBarrierESI 0a05fb44 0f25f3b1 (MethodDesc 15632fbc +0x19 QAction.Finalize()), calling (MethodDesc 15633010 +0 QAction.Dispose()) ...Use the
!dumpmdcommand to obtain more information about the Finalize method.You can use the method descriptor address that is denoted for the
QAction.Finalize:!dumpmd 15632fbc.0:003> !dumpmd 15632fbc Method Name: QAction.Finalize() Class: 0da35d64 MethodTable: 15633044 mdToken: 06000001 Module: 15632a40 IsJitted: yes CodeAddr: 0f25f398 Transparency: Safe criticalUse the
!dumpclasscommand with the address provided on theClass:line to obtain more information about the class:!dumpclass 0da35d64.0:003> !dumpclass 156196fc Class Name: QAction mdToken: 02000003 File: Example Protocol.1.0.0.1.QAction.1, Version=1.0.0.0, Culture=neutral, PublicKeyToken=null Parent Class: 6bbf15c8 Module: 15632a40 Method Table: 15633044 Vtable Slots: 6 Total Method Slots: 6 Class Attributes: 100001 Transparency: Critical NumInstanceFields: 6 NumStaticFields: 0 MT Field Offset Type VT Attr Value Name 1563334c 400000a 4 ...ConnectionFactory 0 instance connectionFactory 115707e0 400000c c ...ing.SLProtocolExt 0 instance protocolExt 6bc08788 400000d 18 System.Boolean 1 instance _disposed 6bc08788 400000e 19 System.Boolean 1 instance _startDispose 0505a66c 400000f 10 ...er.Net.Connection 0 instance _slnetConnection 6bc024d4 4000010 14 System.String 0 instance _subscriptionSetNameNow the line that starts with
File:shows the assembly where this method is defined, which includes the protocol name and QAction ID.