Investigating StackOverflowException occurrences
This section illustrates how to investigate a StackOverflowException that occurs in SLScripting. By way of example, a connector is used that was created with a QAction with a method resulting in infinite recursion (i.e. a recursive method that does not have stop condition). DataMiner automatically creates a dump for this (in the C:\Skyline DataMiner\Logging\CrashDump directory). Below, you will find out how this dump can be investigated.
Investigating the crash dump in Visual Studio
Open the dump file in Visual Studio, and click the Run Diagnostic Analysis link in the Actions list.
A message box titled Exception Unhandled will be shown, with the following message:
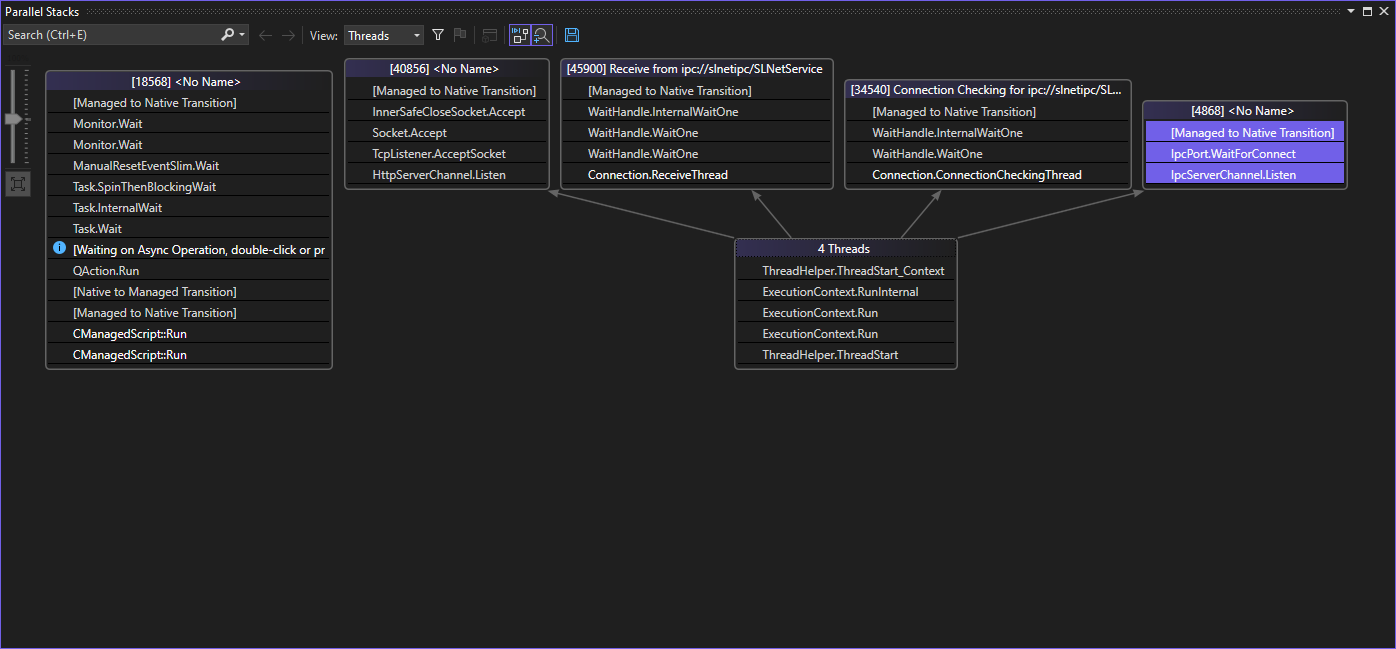
Unhandled exception at 0x080BFA90 in CRASH_HIGH.DMP: 0xC00000FD: Stack overflow (parameters: 0x00000001, 0x0FA32FFC).Open the Parallel Stacks window (Debug > Windows > Parallel Stacks):

Visual Studio Parallel Stacks windowIn this case, the window does not show a stack with the huge number of calls that are typical of an overflow. Using WinDbg could possibly provide more insight.
Investigating the crash dump in WinDbg
Open the dump file with WinDbg.
Execute the
.lasteventcommand.In this case, this shows the following message:
.lastevent
Last event: 4198.99ec: Stack overflow - code c00000fd (first/second chance not available)
Here you can see that a stack overflow occurred.
Use the
!analyzecommand.This results in the following output:
0:016> !analyze
*******************************************************************************
*                                                                             *
*                        Exception Analysis                                   *
*                                                                             *
*******************************************************************************

PROCESS_NAME:  SLScripting.exe

ERROR_CODE: (NTSTATUS) 0xc00000fd - A new guard page for the stack cannot be created.

SYMBOL_NAME:  unknown!noop

MODULE_NAME: Unknown_Module

IMAGE_NAME:  Unknown_Image

FAILURE_BUCKET_ID:  STACK_OVERFLOW_STACK_POINTER_MISMATCH_c00000fd_unknown!noop

FAILURE_ID_HASH:  {9ef5735f-78ee-0757-0797-ccfa8cb3d560}

Followup:     MachineOwner
---------
Here, you can again see a stack overflow being mentioned.
Use the
!threadscommand to list all the managed threads.This results in the following output:
0:013> !threads
ThreadCount:      17
UnstartedThread:  0
BackgroundThread: 13
PendingThread:    0
DeadThread:       2
Hosted Runtime:   no
                                                                         Lock
       ID OSID ThreadOBJ    State GC Mode     GC Alloc Context  Domain   Count Apt Exception
   3    2 2d2c 050227e8     2b220 Preemptive  11AA1FC4:00000000 0500f4b0 0     MTA (Finalizer)
   4   14 d064 0a35c480   102a220 Preemptive  00000000:00000000 0500f4b0 0     MTA (Threadpool Worker)
   6   21 9cb0 0a3564c8   1020220 Preemptive  00000000:00000000 0500f4b0 0     Ukn (Threadpool Worker)
   7   20 9f98 0a355f80     2b220 Preemptive  00000000:00000000 0500f4b0 0     MTA
   8   19 1304 0a357f30     2b220 Preemptive  00000000:00000000 0500f4b0 0     MTA
   9   27 86ec 0a35af60   202b020 Preemptive  11AABD18:00000000 0500f4b0 0     MTA
  10   26 b34c 0a35c9c8   202b020 Preemptive  11C58D8C:00000000 0500f4b0 0     MTA
  11   75 4888 0eee2500   2020220 Preemptive  11CD2C80:00000000 0500f4b0 0     Ukn
  12   52 bf08 0eedfac0     20220 Preemptive  00000000:00000000 0500f4b0 0     Ukn
  16   76 e26c 0a359a40   1029220 Cooperative 11AB7BBC:00000000 0500f4b0 0     MTA (Threadpool Worker)
  17   88 e2fc 0a354fa8   8029220 Preemptive  11AA9C78:00000000 0500f4b0 0     MTA (Threadpool Completion Port)
  19   77 10dac 0a3926f0   1029220 Preemptive  11C1AE08:00000000 0500f4b0 0     MTA (Threadpool Worker)
XXXX   17    0 0a3936c8     39820 Preemptive  00000000:00000000 0500f4b0 0     Ukn
  21   64 cf0c 0a3946a0   8029220 Preemptive  00000000:00000000 0500f4b0 0     MTA (Threadpool Completion Port)
XXXX   59    0 0a3901f8     39820 Preemptive  00000000:00000000 0500f4b0 0     Ukn
  23   82 47f8 0a38f220   1029220 Preemptive  11C74D74:00000000 0500f4b0 0     MTA (Threadpool Worker)
  24   40 e5b0 0a38cd28   1029220 Preemptive  11C76C88:00000000 0500f4b0 0     MTA (Threadpool Worker)
To see the managed call stack of the threads, use the
!dumpstack -eecommand:0:013> !dumpstack -ee ... 0faaf1cc 080bfa96 (MethodDesc 080d0970 +0x6 QAction.RecursiveFunction(Int32)) 0faaf1d0 080bfa96 (MethodDesc 080d0970 +0x6 QAction.RecursiveFunction(Int32)) 0faaf1d4 080bfa96 (MethodDesc 080d0970 +0x6 QAction.RecursiveFunction(Int32)) 0faaf1d8 080bfa96 (MethodDesc 080d0970 +0x6 QAction.RecursiveFunction(Int32)) 0faaf1dc 080bfa96 (MethodDesc 080d0970 +0x6 QAction.RecursiveFunction(Int32)) 0faaf1e0 080bfa96 (MethodDesc 080d0970 +0x6 QAction.RecursiveFunction(Int32)) 0faaf1e4 080bfa96 (MethodDesc 080d0970 +0x6 QAction.RecursiveFunction(Int32)) 0faaf1e8 080bfa96 (MethodDesc 080d0970 +0x6 QAction.RecursiveFunction(Int32)) 0faaf1ec 080bfa96 (MethodDesc 080d0970 +0x6 QAction.RecursiveFunction(Int32)) 0faaf1f0 080bfa96 (MethodDesc 080d0970 +0x6 QAction.RecursiveFunction(Int32)) 0faaf1f4 080bfa96 (MethodDesc 080d0970 +0x6 QAction.RecursiveFunction(Int32)) 0faaf1f8 080bfa96 (MethodDesc 080d0970 +0x6 QAction.RecursiveFunction(Int32)) 0faaf1fc 080bfa96 (MethodDesc 080d0970 +0x6 QAction.RecursiveFunction(Int32)) 0faaf200 080bfa96 (MethodDesc 080d0970 +0x6 QAction.RecursiveFunction(Int32)) 0faaf204 080bfa7b (MethodDesc 080d09f8 +0xb QAction+<>c.<Run>b__0_0()) 0faaf208 7320c0ab (MethodDesc 72f38950 +0x4b System.Threading.Tasks.Task.InnerInvoke()) 0faaf214 732090b1 (MethodDesc 72f388dc +0x31 System.Threading.Tasks.Task.Execute()) 0faaf238 7320907c (MethodDesc 72f38944 +0x1c System.Threading.Tasks.Task.ExecutionContextCallback(System.Object)) 0faaf23c 731a7e34 (MethodDesc 72dccddc +0xc4 System.Threading.ExecutionContext.RunInternal(System.Threading.ExecutionContext, System.Threading.ContextCallback, System.Object, Boolean)) 0faaf2a0 731a7d67 (MethodDesc 72f217fc +0x17 System.Threading.ExecutionContext.Run(System.Threading.ExecutionContext, System.Threading.ContextCallback, System.Object, Boolean)) 0faaf2b4 73208e32 (MethodDesc 72f38d18 +0xe2 System.Threading.Tasks.Task.ExecuteWithThreadLocal(System.Threading.Tasks.Task ByRef)) 0faaf320 73208cd7 (MethodDesc 72f38938 +0xb7 System.Threading.Tasks.Task.ExecuteEntry(Boolean)) 0faaf330 73208c1d (MethodDesc 72f38928 +0xd System.Threading.Tasks.Task.System.Threading.IThreadPoolWorkItem.ExecuteWorkItem()) 0faaf334 732412ad (MethodDesc 72f12934 +0x19d System.Threading.ThreadPoolWorkQueue.Dispatch()) 0faaf384 7324110b (MethodDesc 72f12950 +0xb System.Threading._ThreadPoolWaitCallback.PerformWaitCallback())Here you can see that the stack contains a huge number of RecursiveFunction invocations (the actual stack has been abbreviated here for brevity), revealing the issue.