Microsoft Platform
About
The Microsoft Platform connector allows users to achieve comprehensive, real-time monitoring of their Microsoft Windows-based servers. Leveraging Windows Management Instrumentation (WMI), this connector provides deep visibility on system performance, health metrics, and operational status, ensuring proactive management and swift issue resolution.
Key Benefits
Broad compatibility: Supports all versions of Microsoft Windows, ensuring seamless integration across diverse server environments.
Comprehensive monitoring: Captures a wide array of performance indicators, including CPU usage, memory consumption, disk activity, network interfaces, and running processes.
Enhanced visibility: Offers detailed insights into system events and logs, facilitating effective troubleshooting and system analysis.
Scalable integration: Designed to integrate effortlessly within the DataMiner ecosystem, enabling centralized monitoring and management of IT infrastructures.
Security and compliance: Utilizes secure WMI queries, aligning with organizational security protocols and compliance requirements.
Use Cases
Comprehensive Server Performance Monitoring
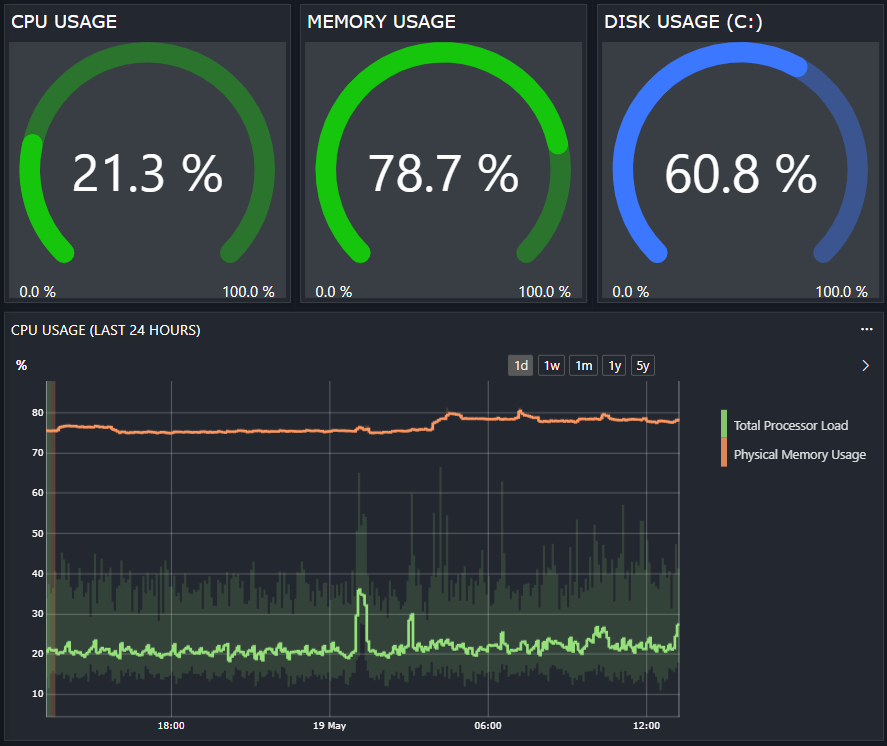
The connector utilizes Windows Management Instrumentation (WMI) to collect key performance indicators form servers running Microsoft Windows OS. This includes monitoring CPU usage, memory consumption, disk activity, and network interface statistics.
Process and Task Monitoring
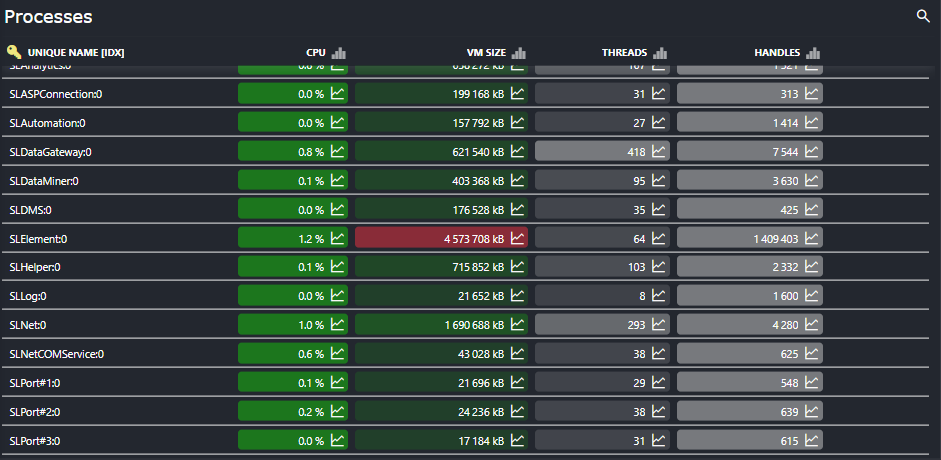
Through the Task Manager table, the connector provides a detailed view of all processes running on the monitored server. Administrators can track active processes, monitor their resource usage, and set up alarms for specific process behaviors, such as unexpected terminations or high resource consumption. This facilitates efficient process management and ensures critical applications remain operational.
Network Interface and Port Monitoring
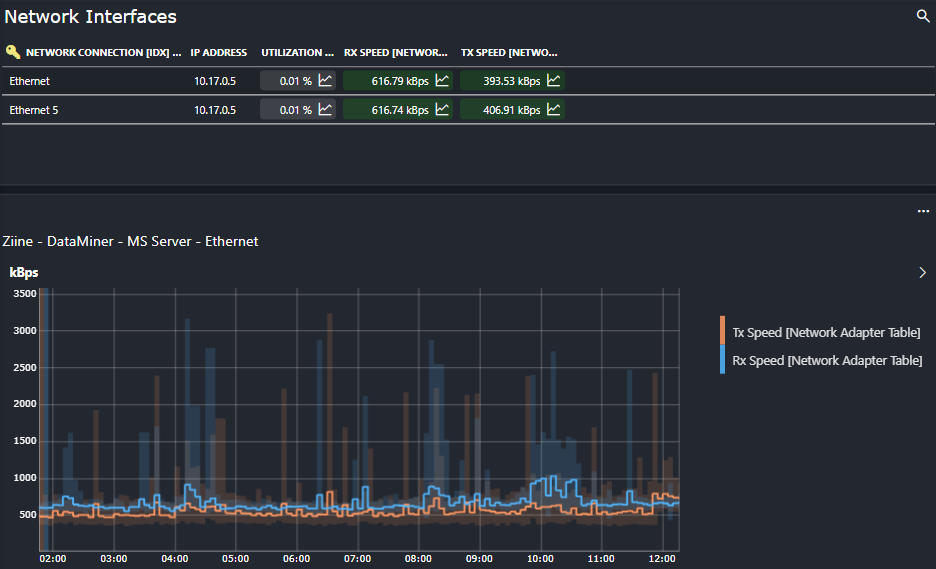
The connector enables monitoring of network adapters, providing data on bandwidth utilization and adapter status. Additionally, it offers port monitoring capabilities to verify whether specific ports are open or closed and to measure response delays. This is crucial for ensuring network connectivity and diagnosis potential communication issues.
Event Log Analysis
By accessing the Windows Event Viewer, the connector allows users to monitor the system and application events. Administrators can configure the connector to generate alarms based on specific event types or severity levels, such as errors and warning. This aids in the early detection of issues and supports compliance and auditing requirements.
Hardware Health Monitoring for Dell and HP servers
For servers manufactured by Dell and HP, the connector provides hardware-specific monitoring features. This includes tracking parameters like temperature, power supply status, fan speeds, CPU health, and memory information. Such detailed hardware monitoring helps in maintaining optimal operating conditions and preventing hardware failures.
Technical Reference
Prerequisites
WMI (Windows Management Instrumentation) access: The connector relies on WMI for data collection, so the target machines must have WMI enabled and accessible.
Proper user permissions: To properly collect data from the target machines, an account that has sufficient privileges to query WMI on the target Windows servers is required.
Network connectivity: Firewalls and security policies must allow DCOM and WMI-related traffic between the DataMiner System and the target machines.
Note
For detailed technical information, refer to our technical documentation for the 7.0.0.x range or for older ranges.