Starlink Enterprise
About
The purpose of this connector is to monitor Starlink devices through the Telemetry API and the Management API over HTTP using JSON files.
Starlink is an internet service that uses a satellite constellation in a low Earth orbit to deliver high-speed low-latency broadband internet. Because Starlink satellites are in a low orbit, at about 550 km from Earth, the round-trip data time between the user and a satellite is significantly lower compared to internet services that make use of single geostationary satellites.
The Starlink Telemetry API is a low-latency API for accessing the telemetry data from Starlink devices. This API is only available for enterprise accounts with an account manager. It is designed for users that have their own data infrastructure to monitor Starlink devices remotely. The API is stateless and will only respond with current telemetry data.
The Starlink Management API is used to activate, deactivate, and otherwise manage Starlink user terminals. Next to this, it can return paginated results containing data usage for the current and previous billing cycles for service lines on an account. Similar to the Telemetry API, this API is only available for enterprise accounts with an account manager.
From version 1.1.0.1 onwards, the connector requires at least one Starlink Enterprise Account element in the DMS. This is because Starlink Enterprise elements are no longer able to poll the information on their own. Since the introduction of the Starlink API V2, a Starlink Enterprise element collaborates with one or more Starlink Enterprise Account elements to poll the information.
The Starlink Enterprise connector was previously known as the Starlink Telemetry API connector. The name was changed to Starlink Enterprise when calls towards the Management API were added. The Starlink Enterprise 1.0.0.1 is the same connector as the Starlink Telemetry API 1.0.0.4. If you have any elements that are still using the Starlink Telemetry API, we recommend upgrading these to the latest version of the Starlink Enterprise connector. This means that a Starlink Enterprise Account element has to be created for every account that was polled before.
Note
LEGAL NOTE: This connector (or package) is intended solely for use in production with Skyline's usage-based services model. Any other use is prohibited. For more detailed information, see Usage-based services. For inquiries regarding commercial production usage, contact Skyline Sales at sales@skyline.be.
Tip
To optimize your use of this connector, we recommend deploying our Standard Product Solution Starlink Enterprise via the Catalog. This way, you will also be able to use the complementary low-code app and standard available dashboards.
Key Features
Conditional polling: Configure telemetry and management information polling per account.
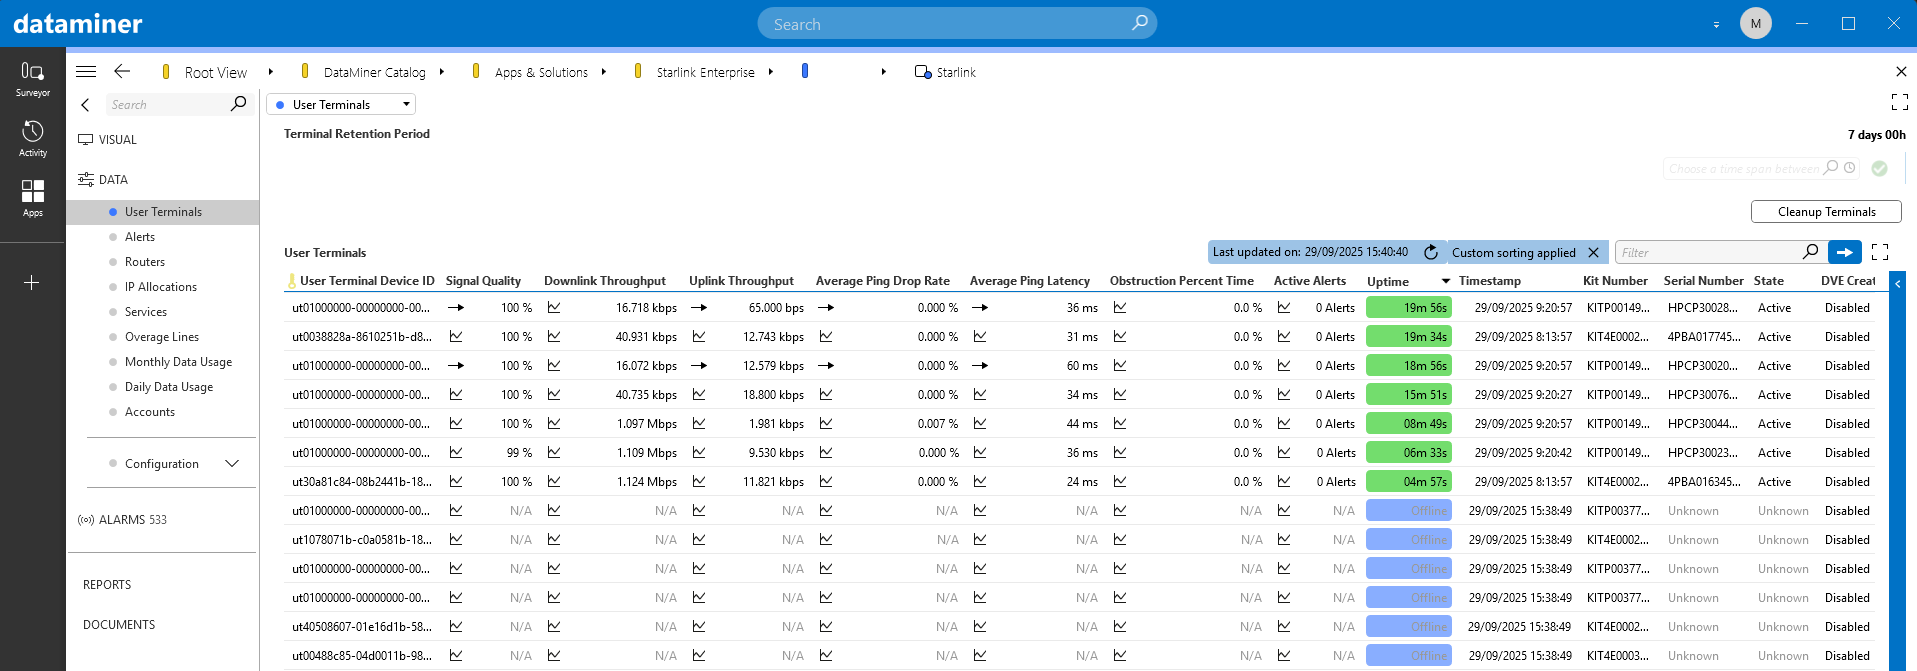
User terminal details: View details on user terminals and service lines.
Data usage: Review and monitor your data usage per month or day by type of data consumed (fixed or mobile, priority or standard). Additional services or data consumed beyond the limit is also shown.
Simulation mode: Replicate real-world scenarios using a simulation extension with built-in logic based on mock accounts and user terminals.
User terminal dynamic virtual elements: Use separate child elements (DVE) to represent the different user terminals, allowing you to view and monitor their data separately. The DVEs will get created automatically using the Starlink Enterprise - User Terminal connector, which gets exported by this connector.
Ticketing system integration: Export a CSV file for customer data elements to ingest for ticketing. This CSV file contains basic info about all terminals with valid service lines.
Use Cases
Offline User Terminals
Challenge: Marking user terminals as offline.
Solution: The connector compares the telemetry data with the management data to distinguish the offline terminals from other terminals.
Benefit: Makes it clear which terminals can be ignored.
Data Usage Bar Graph
Challenge: Showing data usage as a stacked bar graph.
Solution: Data usage tables are built to easily create a stacked bar graph in a dashboard or low-code app.
Benefit: Shows the data usage similar to the web interface.
User Terminal DVEs
Challenge: Creating services with parameters from a subset of terminals.
Solution: Ability to create a dynamic virtual element per user terminal.
Benefit: Monitor the KPIs of the most relevant terminals only.
Load Balancing
Challenge: Too many requests sent from the same IP address.
Solution: Conditional polling of telemetry data.
Benefit: Multiple elements can be created on different hosts. For example, accounts A and B can be polled from server Y, and accounts C and D can be polled from server Z. The overarching dashboard or low-code app can combine this data to show the info of every account.
Telemetry API Changes
Challenge: New column names and changing alert names.
Solution: Unexpected telemetry column names and alerts will be logged in the element log file.
Benefit: The element will indicate by itself when the connector needs to be extended.
Alerts
Challenge: Monitoring based on alerts.
Solution: The connector shows each alert from a user terminal or from a router. Alerts will persist for as long as they are active.
Benefit: Web interface alerts are visible in the DataMiner Alarm Console.
Service Line Top-Up
Challenge: Accounts may occasionally need to purchase additional data beyond the included monthly allocation.
Solution: The connector integrates with the Starlink Management API to provide the features Automatic Top-Up and One-Time Top-Up. Users can trigger a recurring or a single top-up from within the services table. The connector validates product availability, executes the request, and confirms whether the top-up succeeded or failed.
Benefit: Streamlines the process of buying extra data directly through DataMiner and provides immediate feedback to the operator.
Service Line Statistics
Challenge: Terminals can be bonded (two terminals active on one service line) or can swap kits, creating a new terminal ID on the service line.
Solution: The connector aggregates the statistics data up to the service line statistics table. This data is aggregated for all the terminals linked to a service line.
Benefit: Maintains historical trend data at the service line level in the case of bonded terminals and terminals that are swapped out.
Technical Reference
Prerequisites
DataMiner Feature Release 10.4.2 or higher.
Starlink API access: API V2 credentials per account (Client ID, Client Secret) are required for authentication.
Note
For detailed technical information, refer to our technical documentation.