Working with the RAD Manager
Note
This page describes the RAD Manager app as of version 4.0.0. Earlier versions do not support shared model groups and use a different layout. For details on those versions, see Working with the RAD Manager (versions before 4.0.0).
General app layout
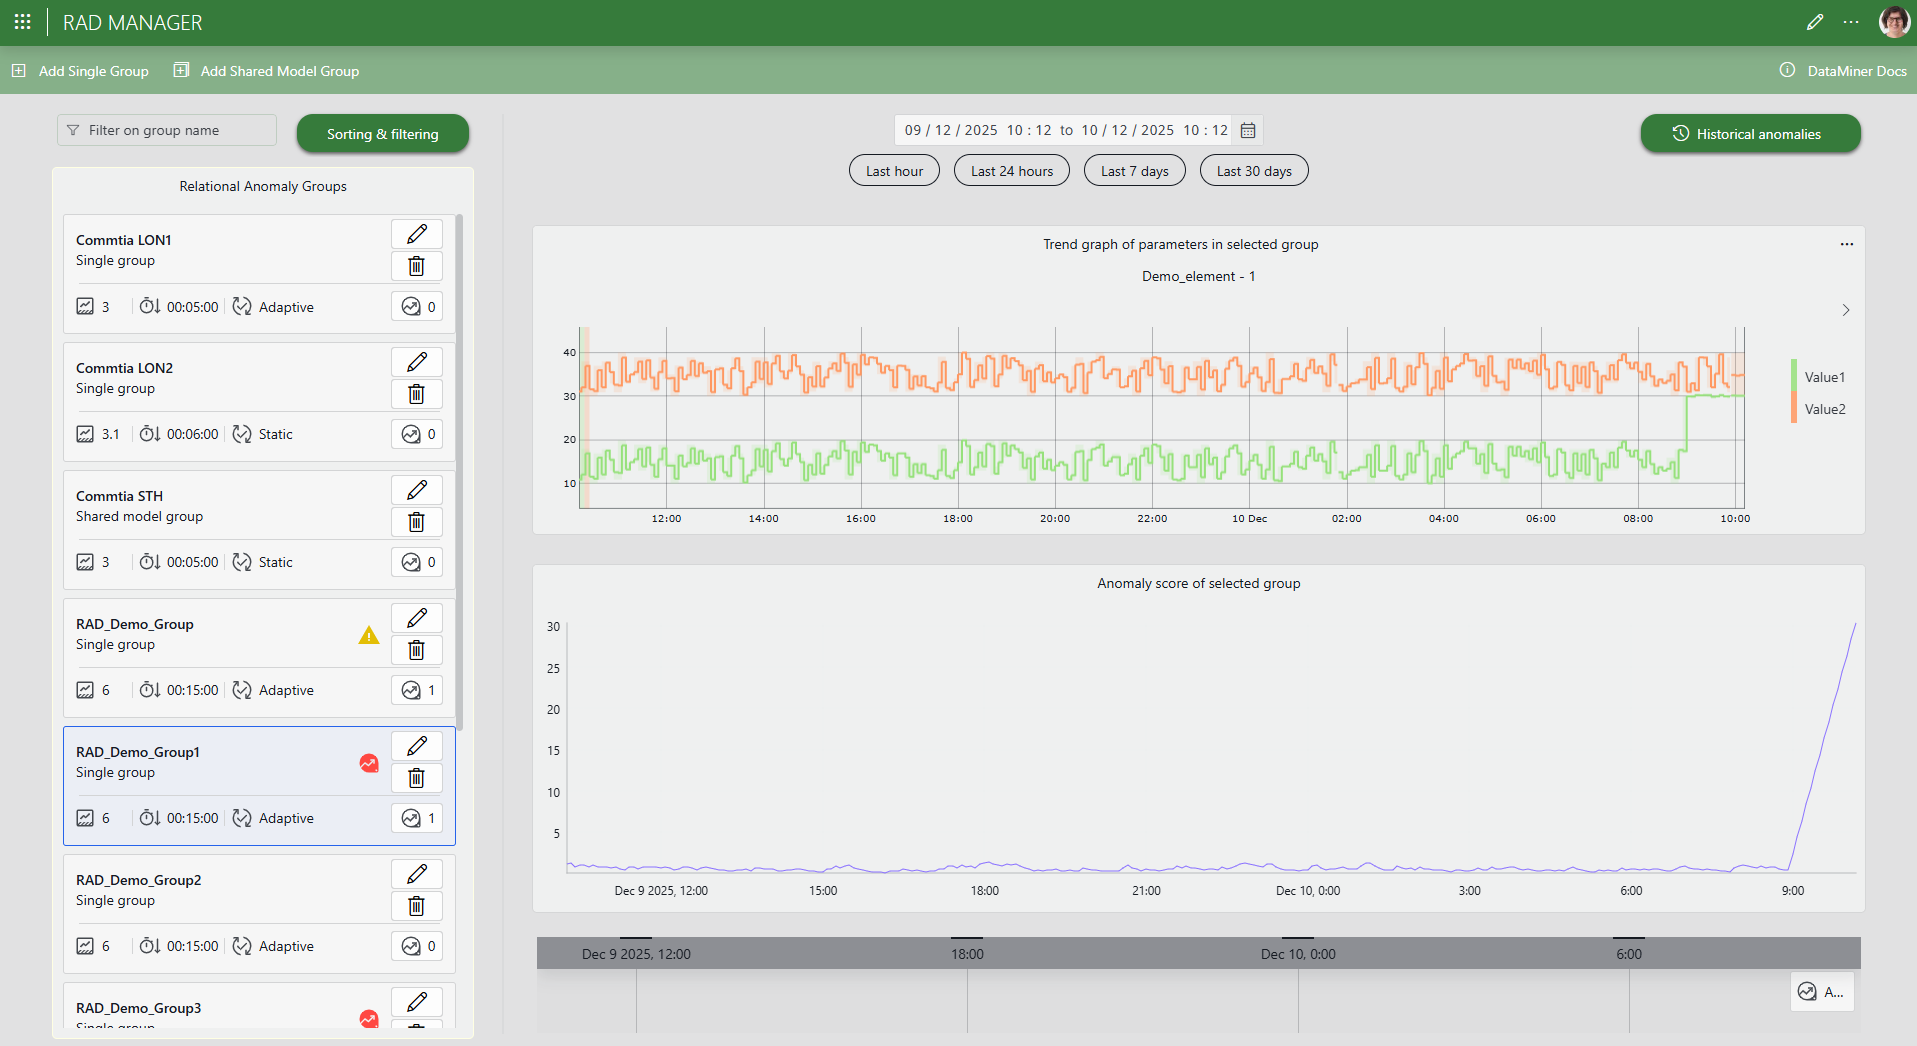
In the pane on the left, the RAD Manager shows an overview all RAD parameter groups that have been configured in the system.
The tile representing each group displays:
The type of group: single or shared model
The group's configuration settings
Buttons to edit or delete the group, as well as a button that shows the historical anomalies detected for the group.
When applicable, the following icons:
 : Indicates a group with an active relational anomaly suggestion event.
 : Indicates a group that can no longer be monitored, for example, because the element or a configured parameter no longer exists.
You can use the Sorting & filtering button at the top to filter the displayed groups or to apply a different sort order.
When you start the app for the first time, the list of relational anomaly groups will typically be empty. To create a new single or shared model group, use the buttons in the header bar.
Single vs. shared model groups
A single group uses its own dedicated relational anomaly model trained solely on that group's parameters. A shared model group allows multiple relational anomaly subgroups to utilize a common detection model, leveraging their combined data.
Selecting a single group in the overview on the left will show trend graphs for each parameter as well as the anomaly scores generated by the current model version on historical trend data.
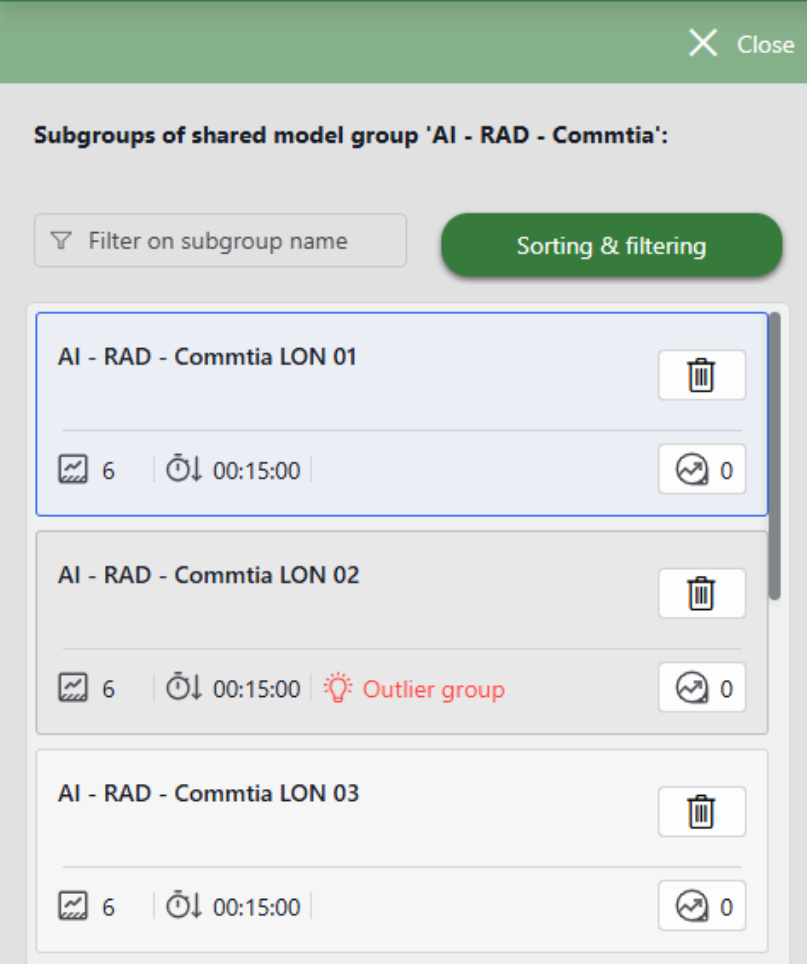
Selecting a shared model group in the overview opens panel showing all of its subgroups. Selecting a subgroup shows the trend graphs and anomaly scores for that subgroup.
Shared model subgroups flagged by Fleet Outlier Detection are explicitly labeled as Outlier Group. You can review these outlier groups by sorting the subgroup view, via the Sorting & filtering button. The outliers are ranked based on a score that quantifies the degree of difference from the rest of the group, with the most statistically anomalous subgroups appearing at the top of the list.
Configuration settings
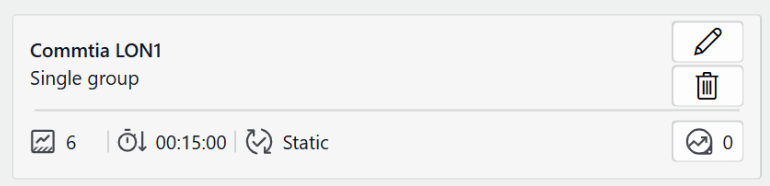
For each group, the following configuration settings are displayed in the relational anomaly groups overview:
 Anomaly threshold: The score threshold used for generating anomalies. When the anomaly score exceeds this threshold, RAD flags the behavior and triggers a suggestion event.
 Minimum anomaly duration: The minimum amount of time that abnormal behavior must persist before being considered a significant anomaly. This works similarly to alarm hysteresis. If this value is greater than 5 minutes, the anomaly must persist longer before a suggestion event is triggered.
 Model type:
Adaptive: RAD continuously updates its internal model as new trend data becomes available. Because the model adapts, it can reduce false positives in systems where "normal" is not constant.
Static: The model is trained once at creation, or again only if you manually define a new training period. This is ideal for consistent, predictable metrics where the baseline does not drift. A static model provides repeatability and control, since it will not update unless you explicitly retrain it.
To modify group configuration settings, you can edit the group.
Tip
See also: Options for relational anomaly groups
Anomaly scores and suggestion events
When you select a single group in the overview of relational anomaly groups or a subgroup of a shared model group, the Anomaly score of selected group graph will visualize how strongly the (sub)group's behavior deviates from the relationships learned by the RAD model. Higher scores indicate more anomalous behavior, while low scores reflect normal, expected behavior.
If RAD detects a score in new data that exceeds the (sub)group's anomaly threshold, it will flag an anomaly and generate a suggestion event.
You can find these events under Suggestion events in the Alarm Console (see Relational anomalies in the Alarm Console) in Cube. If an anomaly event occurs within the selected time range, it is also shown in the timeline component beneath the graphs in the RAD Manager.
Adding a relational anomaly group
Tip
The RAD Manager offers an intuitive interface for creating, configuring, and inspecting relational anomaly groups. However, if you need to create a large number of groups or perform repeated or automated updates, consider using the RAD API for more control.
Adding a single group
Create a single group when you want the highest accuracy for a specific set of parameters, without comparing it to others, and when there is sufficient healthy data available for that group.
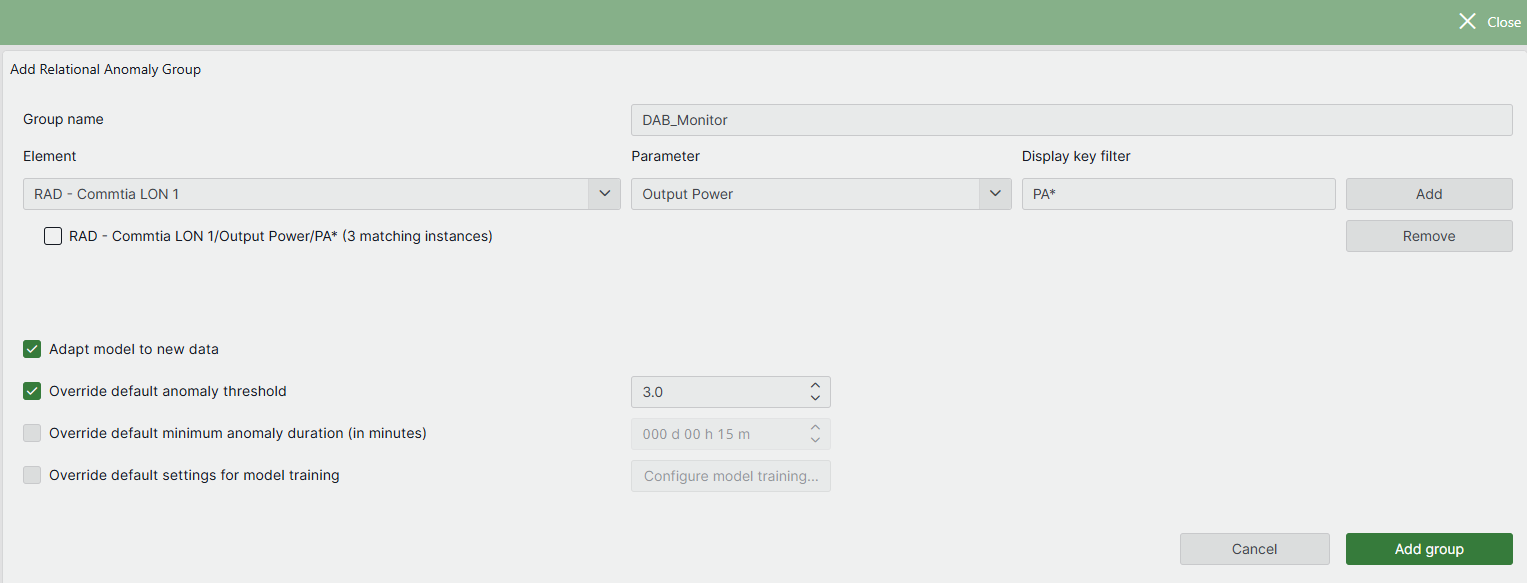
In the header bar, click Add Single Group.
Specify the name of the group.
The group name will be used when listing the configured groups in the main window and in suggestion events generated when an anomaly is detected.
Add at least two parameter instances:
Select the correct element in the Element dropdown.
Select the parameter.
If you have selected a table parameter, specify the display key of the parameter instance under Display key filter. If your table parameter has no display key, specify the primary key instead.
Click the Add button.
Repeat the previous steps until you have added all the parameter instances you want.
You can specify multiple instances for the same parameter by using wildcard characters * and ? under Display key filter. (See Searching with wildcard characters.)
Note
Only parameters that meet the limitations and prerequisites for RAD are shown in the Add Single Group window.
Optionally, select different options for the relational anomaly group.
When you have fully configured the group, click Add group.
Adding a shared model group
Shared model groups are ideal when monitoring many similar entities or when some subgroups have insufficient healthy training data. Create a shared model group when consistency and scalability are prioritized over the specialized, subgroup-specific accuracy of isolated models.
In the header bar, click Add Shared Model Group.
Specify the name of the shared model group.
Specify the number of parameters per subgroup, and optionally use Edit Labels to assign a descriptive label to each.
For example, a shared model group can be used to monitor a fleet of AC units across a large building complex. Since all units operate under similar principles, they can share a common anomaly detection model, which helps to mitigate the sparse healthy training data that might exist for any single unit. If you are monitoring multiple AC units (subgroups) that relate temperature to power, you could define the labels Supply_Air_Temperature and Compressor_Power in the shared model group.
These consistent, descriptive labels will then appear in RAD suggestion events and the RAD Manager app, ensuring uniform interpretation across the entire fleet of units.
Add at least two subgroups of parameters:
Click the Add subgroup button.
Optionally specify a group name for the subgroup. If no subgroup name is provided, the name of the shared model group will be used when creating suggestion events.
Select the parameters. If you select a table parameter, specify the display key of the parameter instance under Display key filter.
Note
- Only parameters that meet the limitations and prerequisites for RAD are shown in the Add Shared Model Group window.
- Ensure that the parameter order is consistent across all subgroups. For example, if Supply_Air_Temperature is selected as the first parameter and Compressor_Power as the second in the first subgroup, then Supply_Air_Temperature must also be the first parameter in every other subgroup.
Optionally select different options for the relational anomaly group for the subgroup. If no options are selected, the subgroup will be monitored using the options defined for the shared model group.
Click OK to add the subgroup.
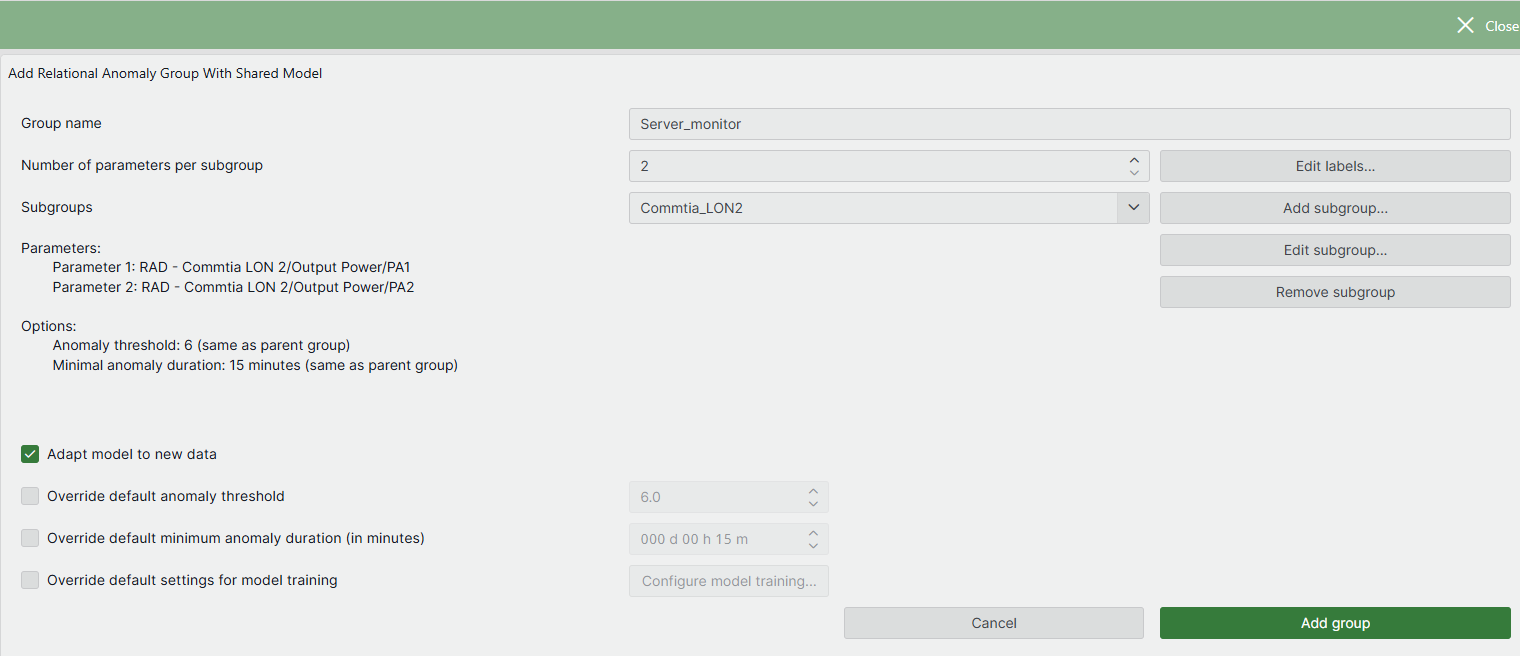
Optionally, select different options for the relational anomaly group for the shared model group.
When the configuration is complete, click Add group.
Editing a relational anomaly group
To edit an existing group, click the Edit pencil icon  for that group in the overview on the left.
This will open a window where you can change the group name, add or remove parameters, and modify group options. For more details, refer to Adding a single group and Adding a shared model group.
Configuring model training
Retraining RAD's internal model can be beneficial in certain cases. It enables you to define time periods during which the relational anomaly group was behaving normally, helping RAD more accurately detect future deviations. By default, RAD trains each group upon creation using all available five-minute average trend data (up to a maximum of two months). If this initial training period included anomalous data or limited data, or if parameter behavior has changed over time, retraining with a specified time range can improve model accuracy.
To retrain the relational anomaly model for a group:
Edit the relational anomaly group, select Retrain relational anomaly model and click the Configure model training button.
This will open the Configure model training window, where you can specify one or more time ranges that will be used to retrain the selected relational anomaly group..
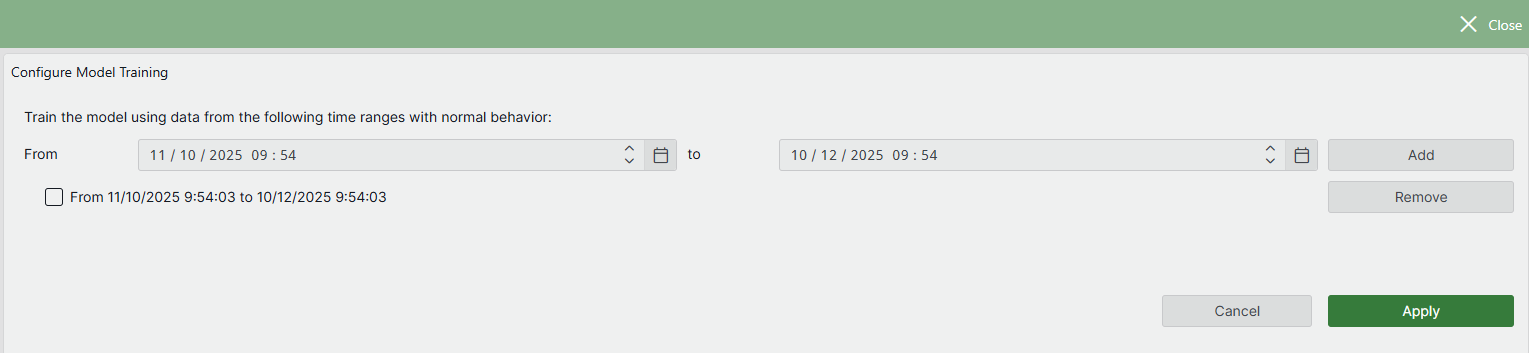
To add a time range, select the desired start and end time in the From and to boxes, and then click Add.
Repeat the process to add additional time ranges.
Once you have added all desired time ranges, click Apply.
This will immediately retrain the relational anomaly group, and you will see the resulting anomaly scores in the main window.
Removing a relational anomaly parameter group
To delete a group, click the ![]() icon for that group in the overview on the left.
icon for that group in the overview on the left.
When a group is removed, it will no longer be monitored by RAD. All active suggestion events linked to the group will automatically be cleared.
Viewing historical anomalies
The Historical Anomalies button in the upper-right corner of the RAD Manager app opens a side panel listing all detected historical anomalies for the selected relational anomaly group. Clicking the Show button for an anomaly highlights the anomaly occurrence in the trend graphs of the main window.
You can also open this side panel by clicking the  icon on the relational anomaly group tile in the overview on the left side of the main page. This will show the anomalies in the last 30 days. The icon also provides a quick visual indication of the number of anomalies detected in the past 30 days, for example:
  .
.