Working with relational anomaly detection
This tutorial showcases DataMiner's relational anomaly detection (RAD) feature. It show how you can use this feature to monitor the power outputs of all power amplifiers in a DAB transmitter to ensure they remain in sync. You will first need to specify the parameters that should be monitored together, and then the algorithm will automatically detect the relations between the parameters and generate suggestion events in the Alarm Console when it detects that these relations are broken.
Estimated duration: 35 minutes.
Note
The content and screenshots for this tutorial have been created with DataMiner 10.6.1 and RAD Manager version 4.0.0.
Prerequisites
A DataMiner System connected to dataminer.services.
DataMiner 10.6.0/10.6.1 or higher with Storage as a Service (STaaS) (recommended) or a self-managed Cassandra-compatible database and indexing database.
Relational Anomaly Detection is enabled (in DataMiner Cube: System Center > System settings > analytics config).
Overview
The tutorial consists of the following steps:
- Step 1: Install the example package from the Catalog
- Step 2: Check the DAB transmitter elements in Cube
- Step 3: Configure your first RAD group
- Step 4: Create a problem and verify if RAD detects it
- Step 5: Tweak the advanced configuration
- Step 6: Create a shared model group
- Step 7: Use the API to configure RAD groups
- Step 8: Play around with the Fleet Outlier Radar
- Step 9: Clean up your system
Step 1: Install the necessary packages from the Catalog
Go to the RAD Demonstrator package in the Catalog.
Deploy the package to your DataMiner Agent by clicking the Deploy button.
This will create two automation scripts, which you can find in the folder DataMiner Catalog > RAD Demonstrator in the Automation module:
- Add Shared Model Group
- Add Single Groups
The package will also create the following DataMiner elements in the Cube Surveyor under DataMiner Catalog > Using Relational Anomaly Detection > London:
- RAD - Commtia LON 1
- RAD - Commtia LON 2
- RAD - Commtia LON 3
- RAD - Commtia LON 4
- RAD - Commtia LON 5
Finally, it will create 13 additional elements, Fleet-Outlier-Detection-Commtia 01, Fleet-Outlier-Detection-Commtia 02, etc. up to Fleet-Outlier-Detection-Commtia 13, in the Cube Surveyor under DataMiner Catalog > Using Relational Anomaly Detection > RAD Fleet Outlier.
Go to the RAD Manager package in the DataMiner Catalog and deploy it.
Go to the root page of your DataMiner System, for example by clicking the Home button for your DMS on the dataminer.services page, and check if you can see the RAD Manager app.
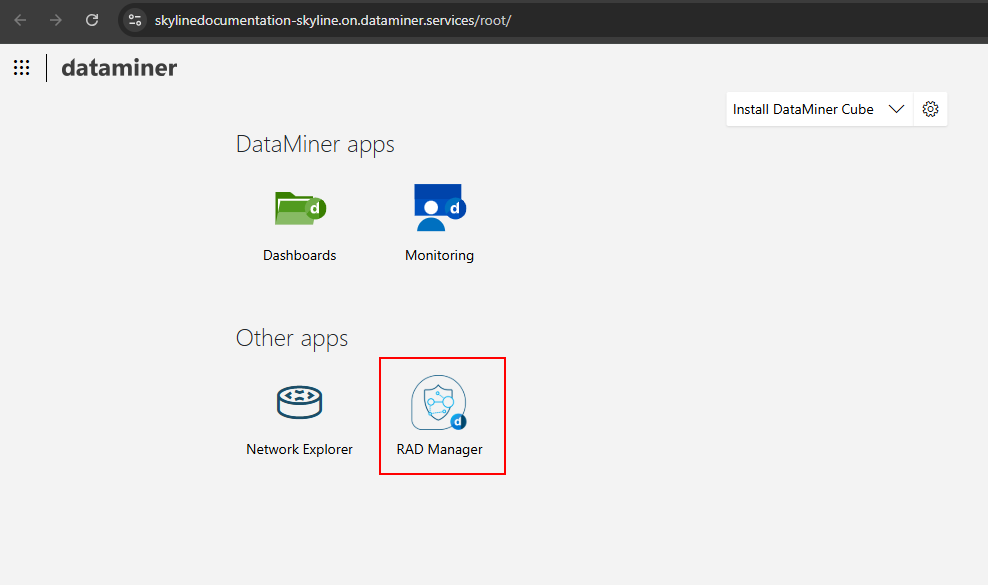
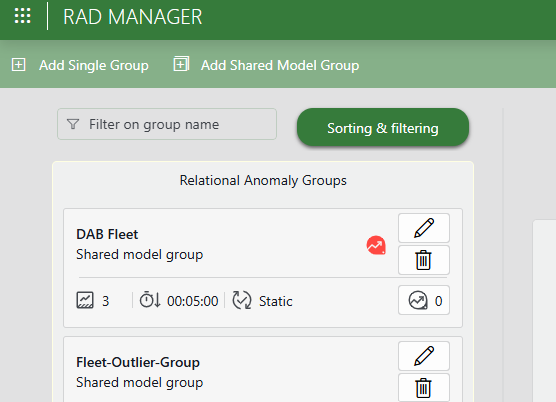
Open the RAD Manager app.
The RAD Manager provides an overview of all the RAD groups that are configured on your system. If you have not configured any groups yet, this list will be empty. In this tutorial, you will learn how to create and configure several RAD groups using this application.
Step 2: Check the DAB transmitter elements in Cube
In the Surveyor, open the view DataMiner Catalog > Using Relational Anomaly Detection > London, and select the element RAD - Commtia LON 1.
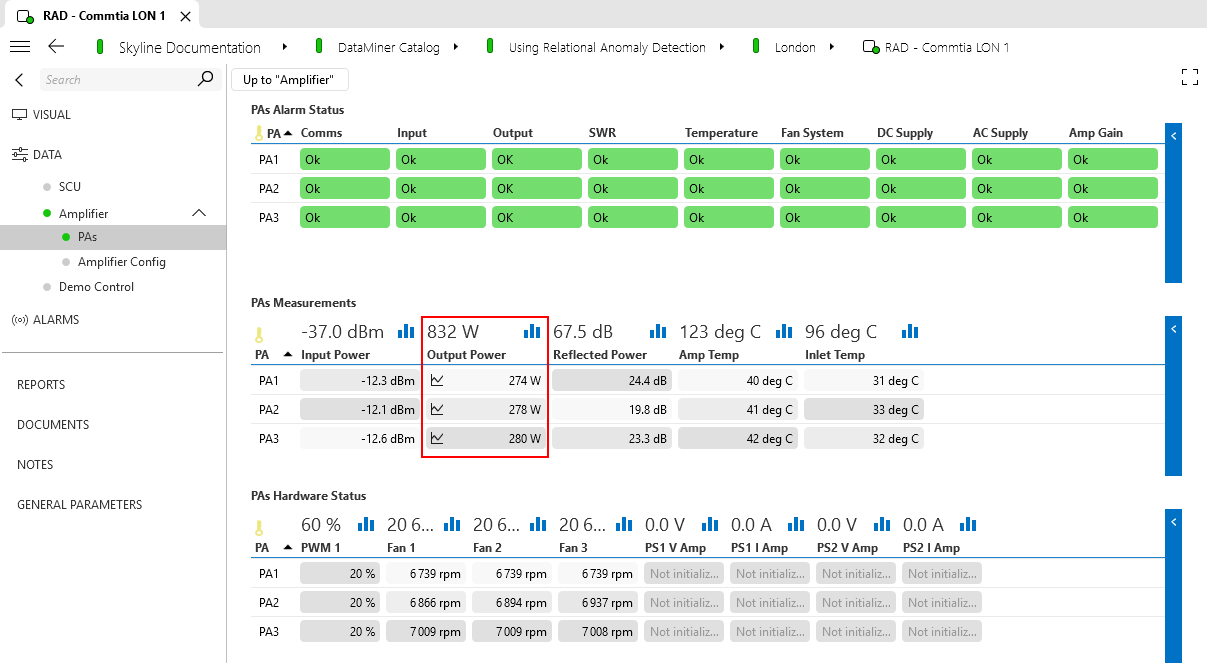
Go to the Amplifier > PAs page.
This page provides information about the different power amplifiers (PAs) in the DAB transmitter.
In the PAs Measurements table, look at the Output Power column.
All three power amplifiers should have similar output power values.
Next, go to the main Amplifier page and look at the Tx Amplifier Output Power parameter.
This should be a little bit less than the sum of the previously mentioned output power values.
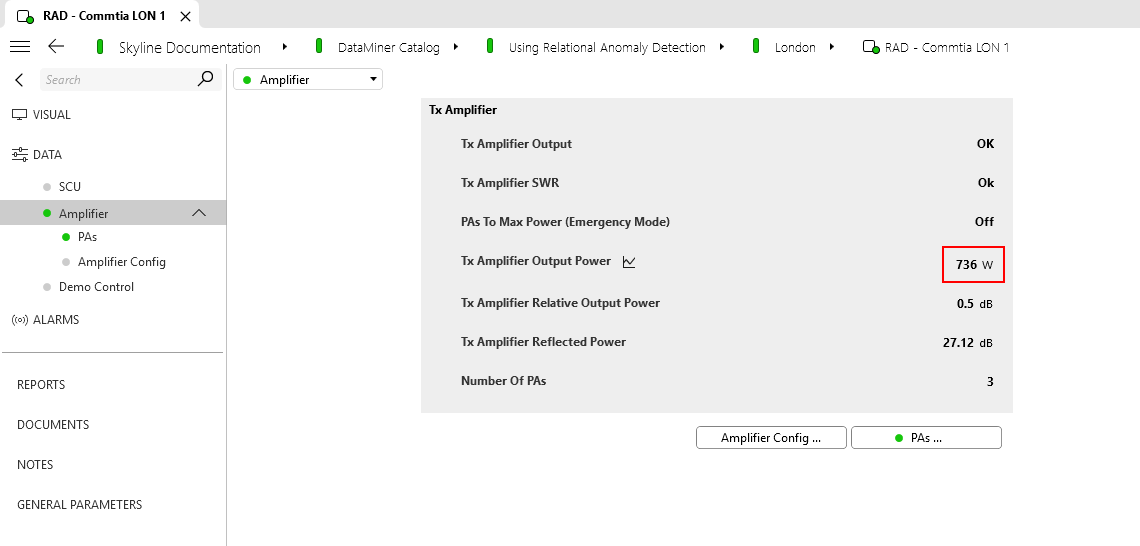
This gives you an idea of the parameter relations that will be used further in this tutorial: the output power of the different amplifiers in the DAB transmitter should be more or less equal, and the total output should be equal to the sum of these values with some losses.
Step 3: Configure your first RAD group
Go to the RAD Manager app.
On the left side of the header bar, click Add Single Group.
This will open a window where you can configure a new parameter group.
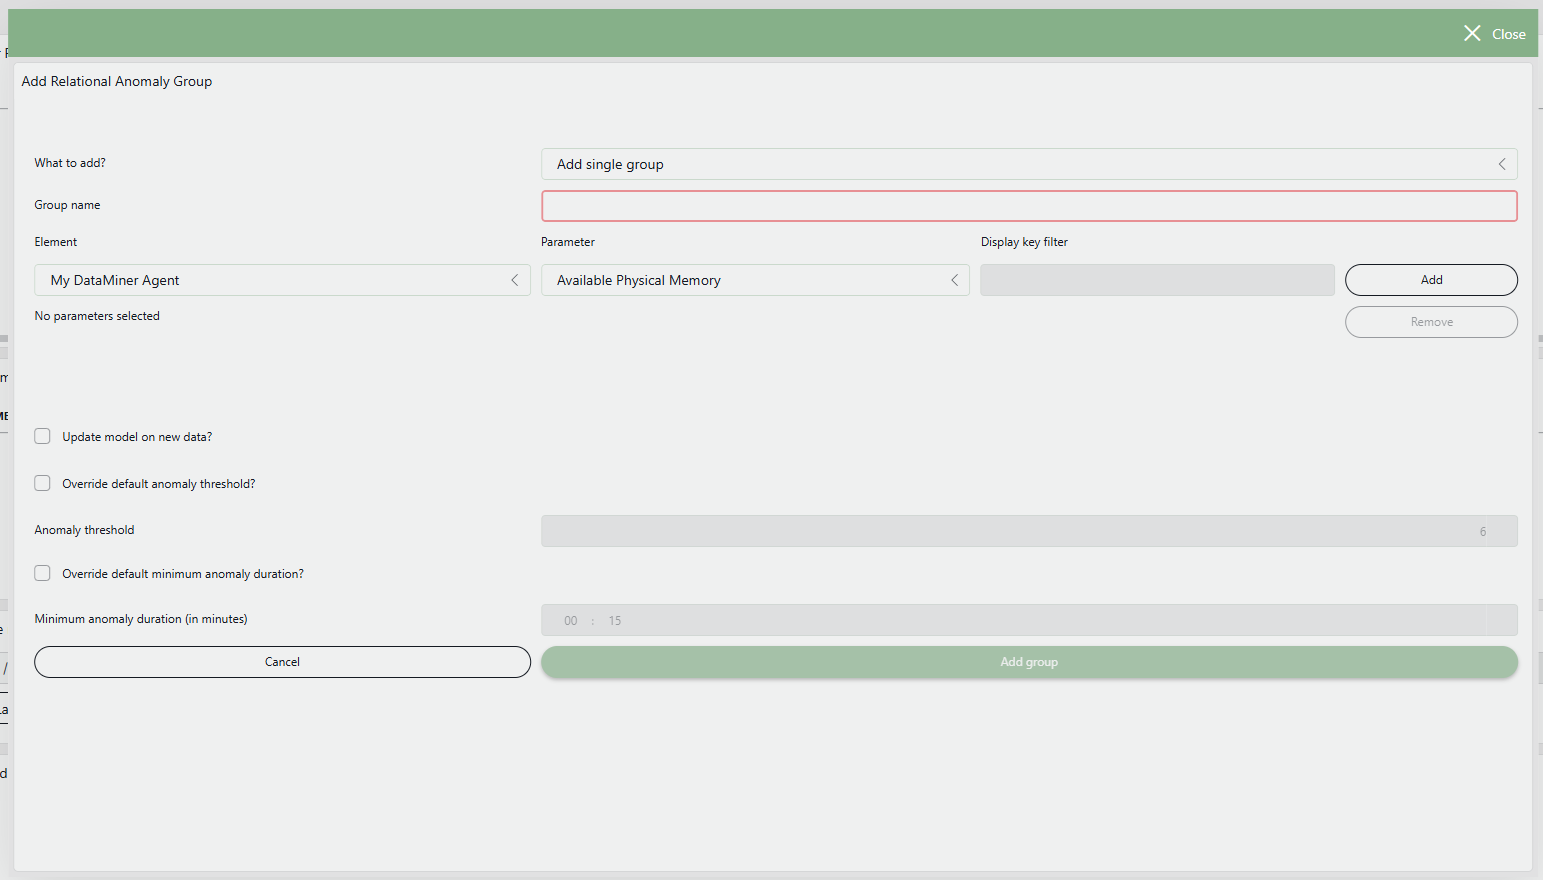
As the Group name, fill in PAs unbalanced.
Parameter groups should be given a meaningful name, because this name will be shown as part of the event that is triggered when the relation between the parameters is broken.
Add a first parameter:
In the Element box, select RAD - Commtia LON 1.
Make sure the Output Power parameter is selected.
Under Display key filter, specify
PA*.Note that as the group will be used to monitor all available power amplifiers, you could actually also leave this field empty.
Click Add.
This informs DataMiner that you want to monitor the Output Power of PA1, PA2, and PA3 together.
Add a second parameter:
Keep the RAD - Commtia LON 1 element selected.
Select the Tx Amplifier Output Power parameter.
Keep the Display key filter empty.
Click Add.
Override the default anomaly threshold:
Select the Override default anomaly threshold checkbox
Fill in 3 in the box next to the checkbox.
This will make DataMiner more sensitive to deviations in the relations between the parameters. By default, an event will only be triggered when the "anomaly score" exceeds 6, but in this example the deviation of the parameters will be too small to lead to such a high anomaly score.
Override the default minimum anomaly duration:
Select the Override default minimum anomaly duration (in minutes) checkbox.
Fill in the value 000d 00h 05m in the box next to the checkbox.
This will make sure that DataMiner also detects short anomalies, when the relation is broken for only 5 minutes. By default, DataMiner will only trigger an event if the relation is broken for at least 15 minutes.
Click Add group to create the group.
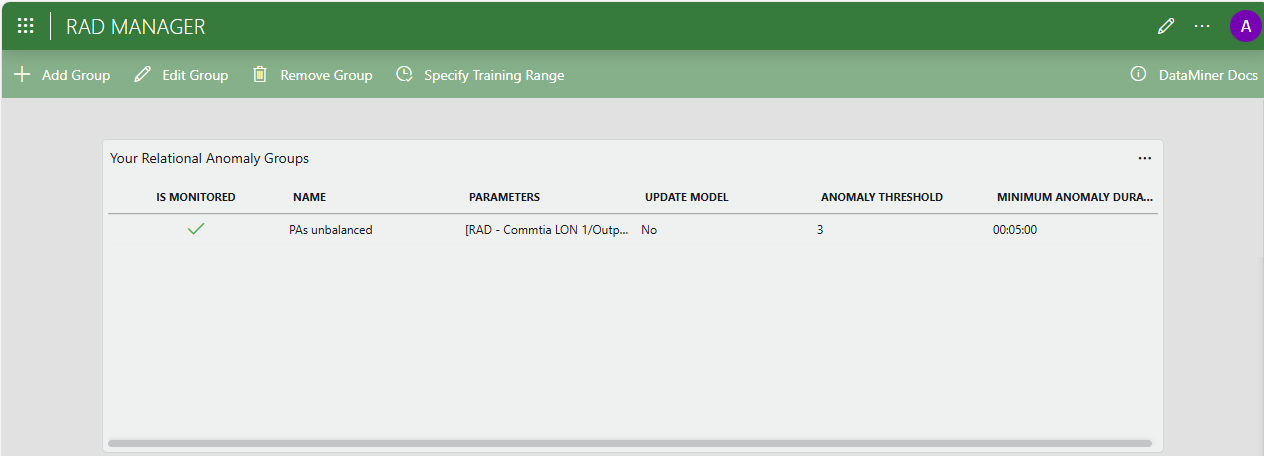
The group entitled PAs unbalanced will now be created and shown in the RAD Manager.
Step 4: Create a problem and verify if RAD detects it
In Cube, open the RAD - Commtia LON 1 element.
Go to the Demo Control page.
Make sure Demo Status is set to Ready.
When the element was created, it pushed some historical trend data to the database. This data is used by the algorithm to learn the relations between the parameters. The demo status will be set to Ready as soon as the history data is processed. This whole process should take about 5 minutes.
Click the Add Degradation button, and confirm if necessary.
This will cause the Output Power of PA3 to start deviating from the output powers of the other two amplifiers.
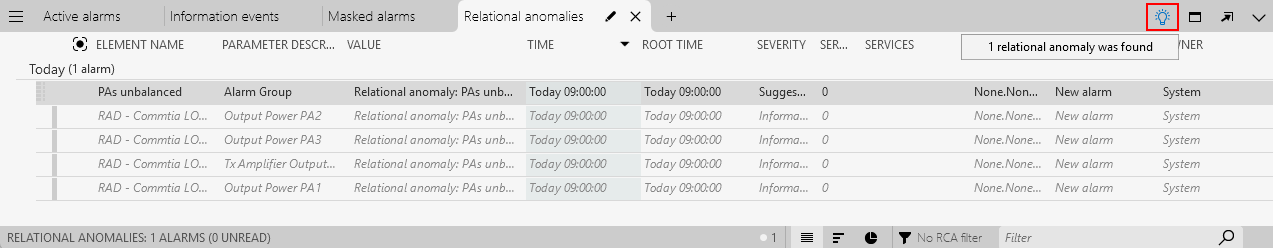
In the Alarm Console, click the lightbulb icon in the upper-right corner and select the item referring to relational anomalies.
You will see an event informing you that the relation between the Output Power of the amplifiers and the Tx Amplifier Output Power is broken.
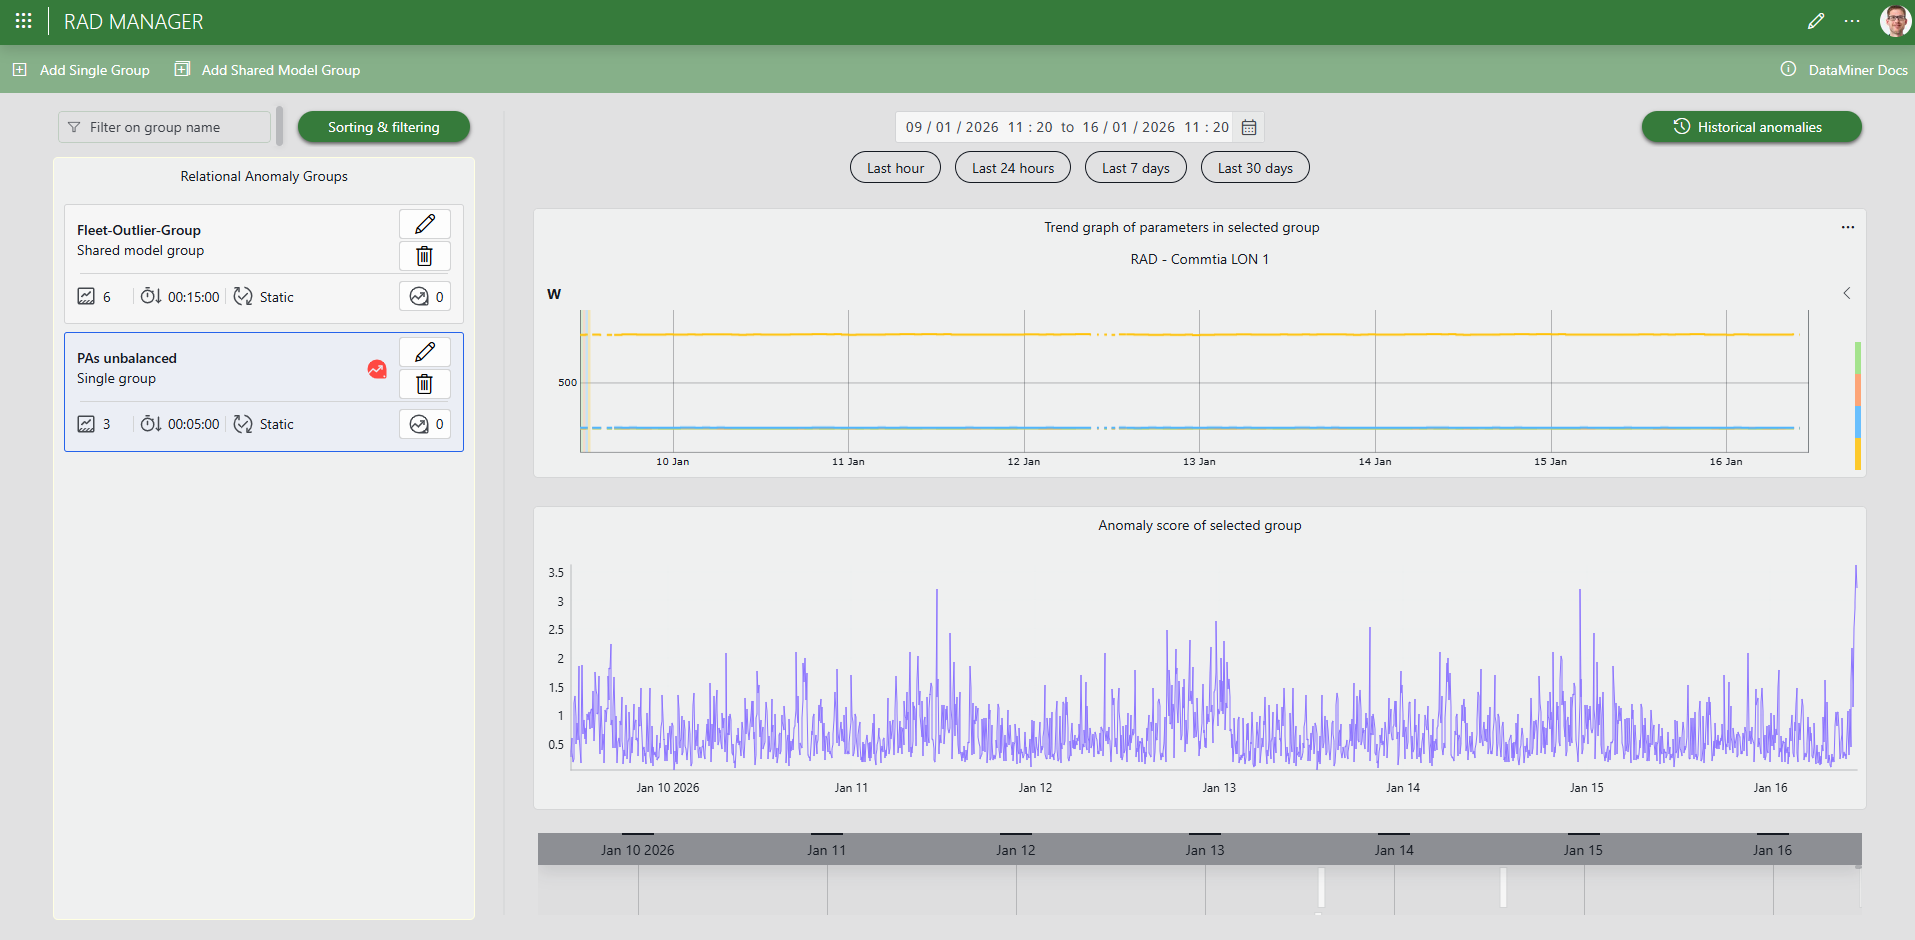
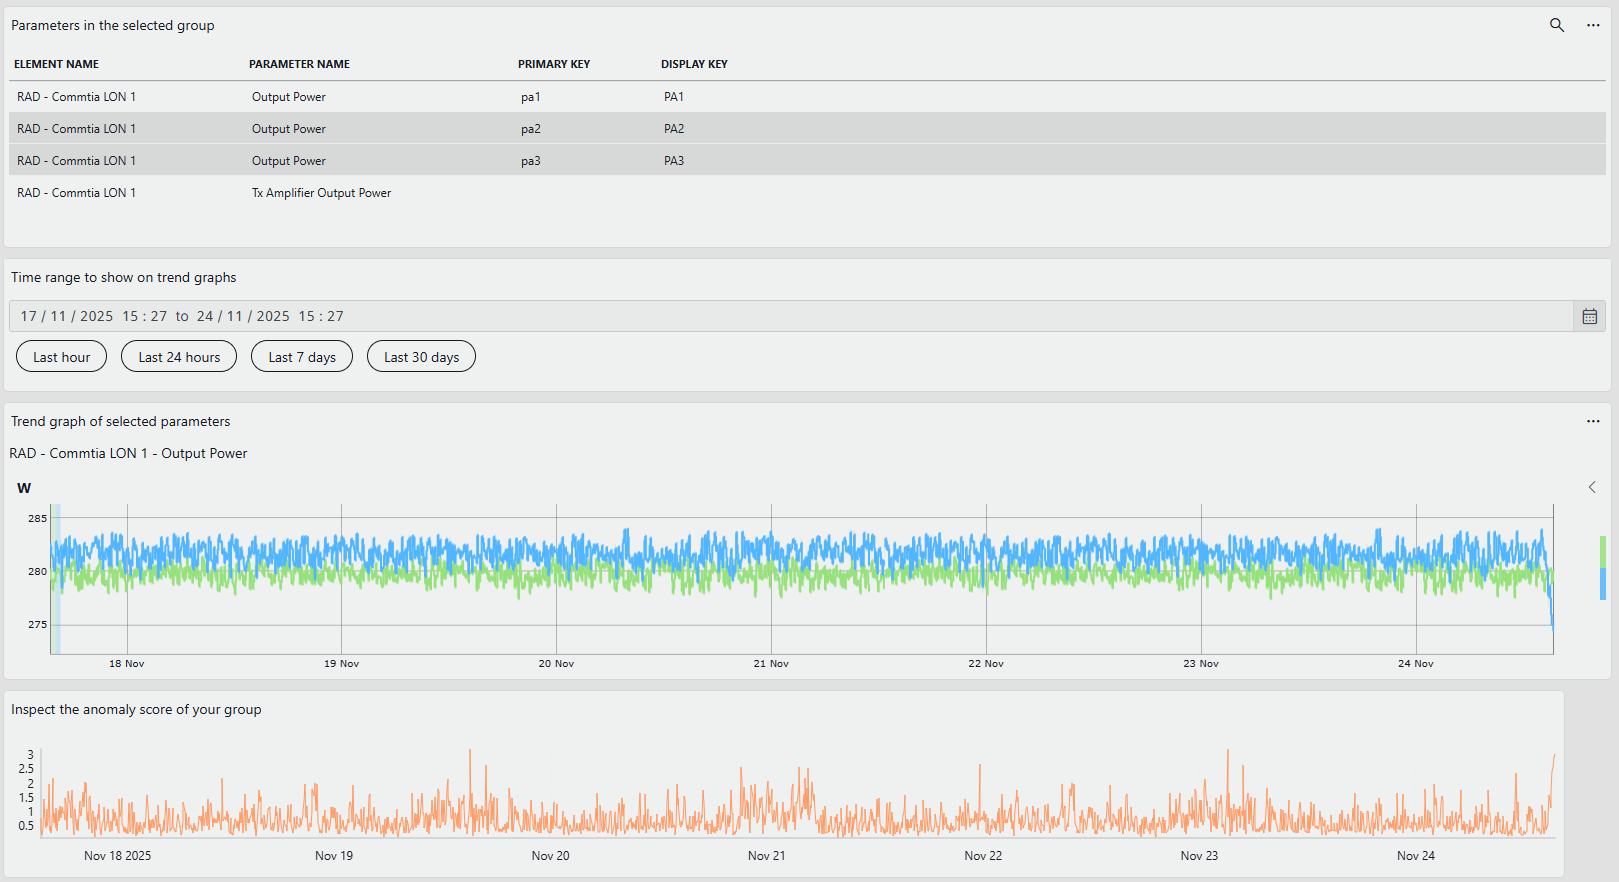
In the RAD Manager app, select the group you created.
The Trend graph of parameters in selected group graph will now display the parameters included in your group.
Note
Note the red icon on the PAs unbalanced group, indicating there was an anomaly. If you do not see this icon yet, refresh the RAD Manager page in your browser.
On the trend graph component on the right, click the < button to display the list of parameters in the group, and click the Output Power - pa1 and Tx Amplifier Output Power to remove them from the graph.
Above the graph, select the time range covering the last 24 hours.
This will give you a better view of the parameter trends before and after you created the degradation.
Investigate the trend and anomaly score:
Notice how, during the last hour, the PA3 parameter started deviating from the PA2.
In the Anomaly score of selected group graph, notice how the anomaly score went up during the last hour.
The anomaly score expresses how strongly the model believes that the relations between the parameters are broken at any given time. The fact that the anomaly score exceeded the configured anomaly threshold of 3 is what led the system to trigger the RAD event in the Alarm Console in Cube.
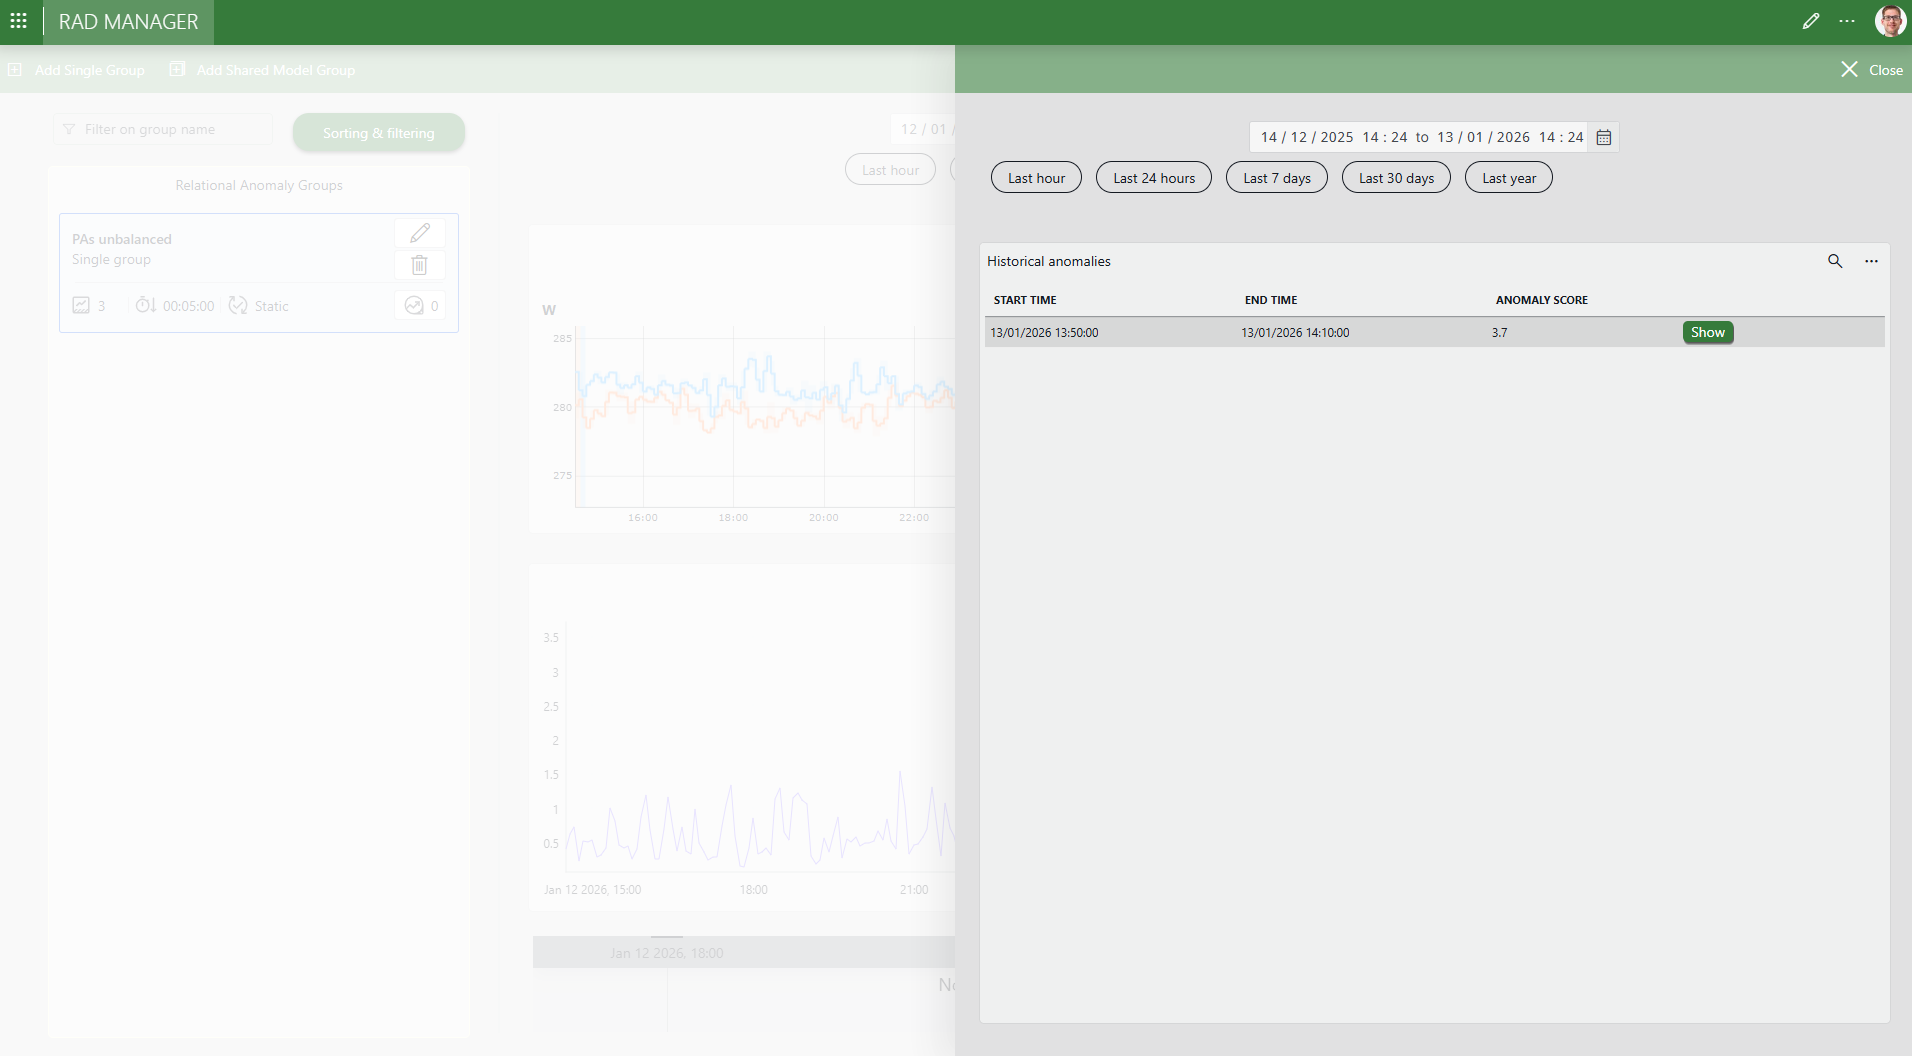
In the upper-right corner, click the Historical anomalies button.
This will open a panel that displays all the historical anomalies detected for the selected group in the selected time range.
Step 5: Tweak the advanced configuration
Despite the fact that the algorithm is fully automatic, you can still influence its behavior by tweaking some advanced options. In this step, you will learn how you can for instance suppress events created as a result of a short maintenance or cleaning operations.
In the RAD Manager, create a new group by clicking the Add Single Group button in the header bar.
In the Group name field, enter PA Maintenance.
Select the RAD - Commtia LON 2 element this time.
As before, select the Output Power parameter,optionally filter on
PA*, and click Add.Select the Tx Amplifier Output Power parameter, keep the Display key filter empty, and click Add.
As before, select Override default anomaly threshold and fill in the value 3.
Select the Override default minimum anomaly duration (in minutes) checkbox, but this time fill in the value 000d 00h 20m.
This means that the relation should be broken for at least 20 minutes before an event is triggered.
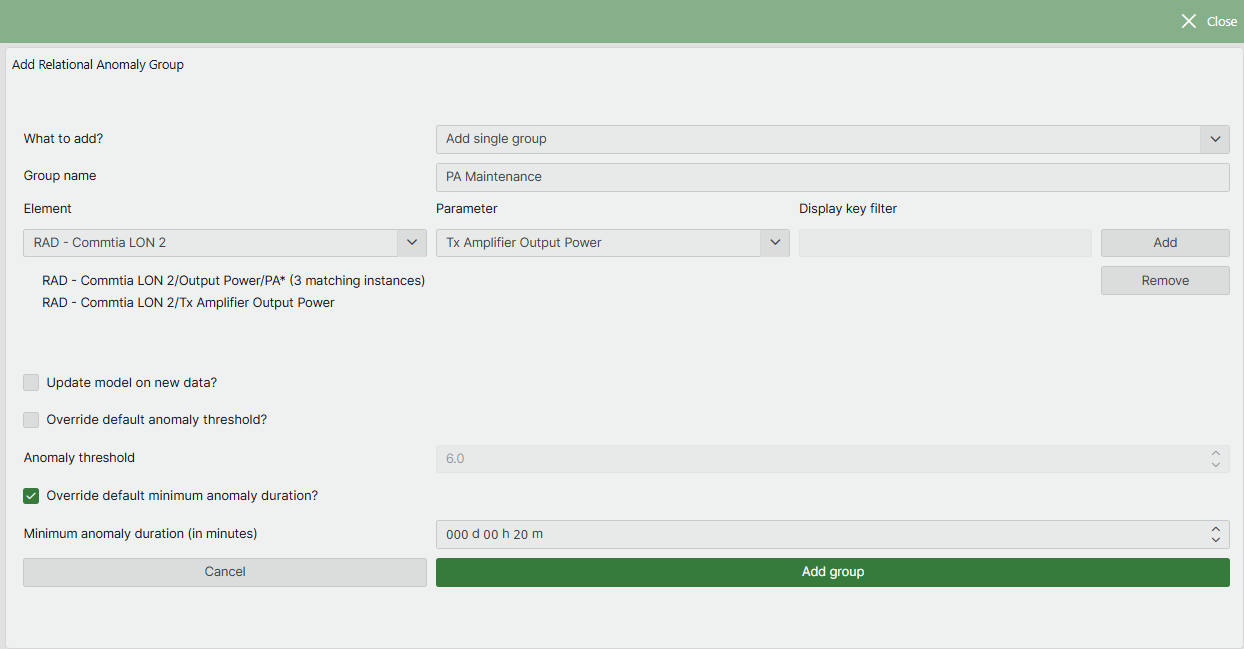
Click Add group.
In Cube, open the RAD - Commtia LON 2 element.
Go to the Demo Control page.
Make sure Demo Status is set to Ready.
Click the Simulate Reboot button.
This will create a short deviation between the PA2 and PA3 output power.
Check the Alarm Console: no new relational anomaly should be shown.
Step 6: Create a shared model group
Typically, you will want to monitor not just one single DAB transmitter but multiple transmitters. To accomplish this, you could create a single RAD group for each transmitter, similarly to what you have done above. However, an often preferred alternative is to create just one RAD group that monitors multiple transmitters together using a shared model.
On the one hand, the downside of using one common shared model is that the model is trained on a collection of transmitters, so it is less attuned to the specific characteristics of each individual transmitter. This might lead to a slightly lower anomaly detection accuracy for each individual transmitter.
On the other hand, a shared model comes with several advantages:
You only need to create and maintain one single RAD group instead of multiple ones.
The model can learn from a larger dataset (data from multiple transmitters), which can lead to a more robust model that is better at generalizing and detecting anomalies.
Your DataMiner System will use less resources because only one model needs to be stored and updated instead of multiple ones.
The model can detect which individual transmitters (if any) are behaving differently from their peers. This can help you decide to prioritize maintenance on those transmitters.
In this step, you will learn how to create a shared model group.
In the header bar of the RAD Manager, click Add Shared Model Group.
This will open the following window:
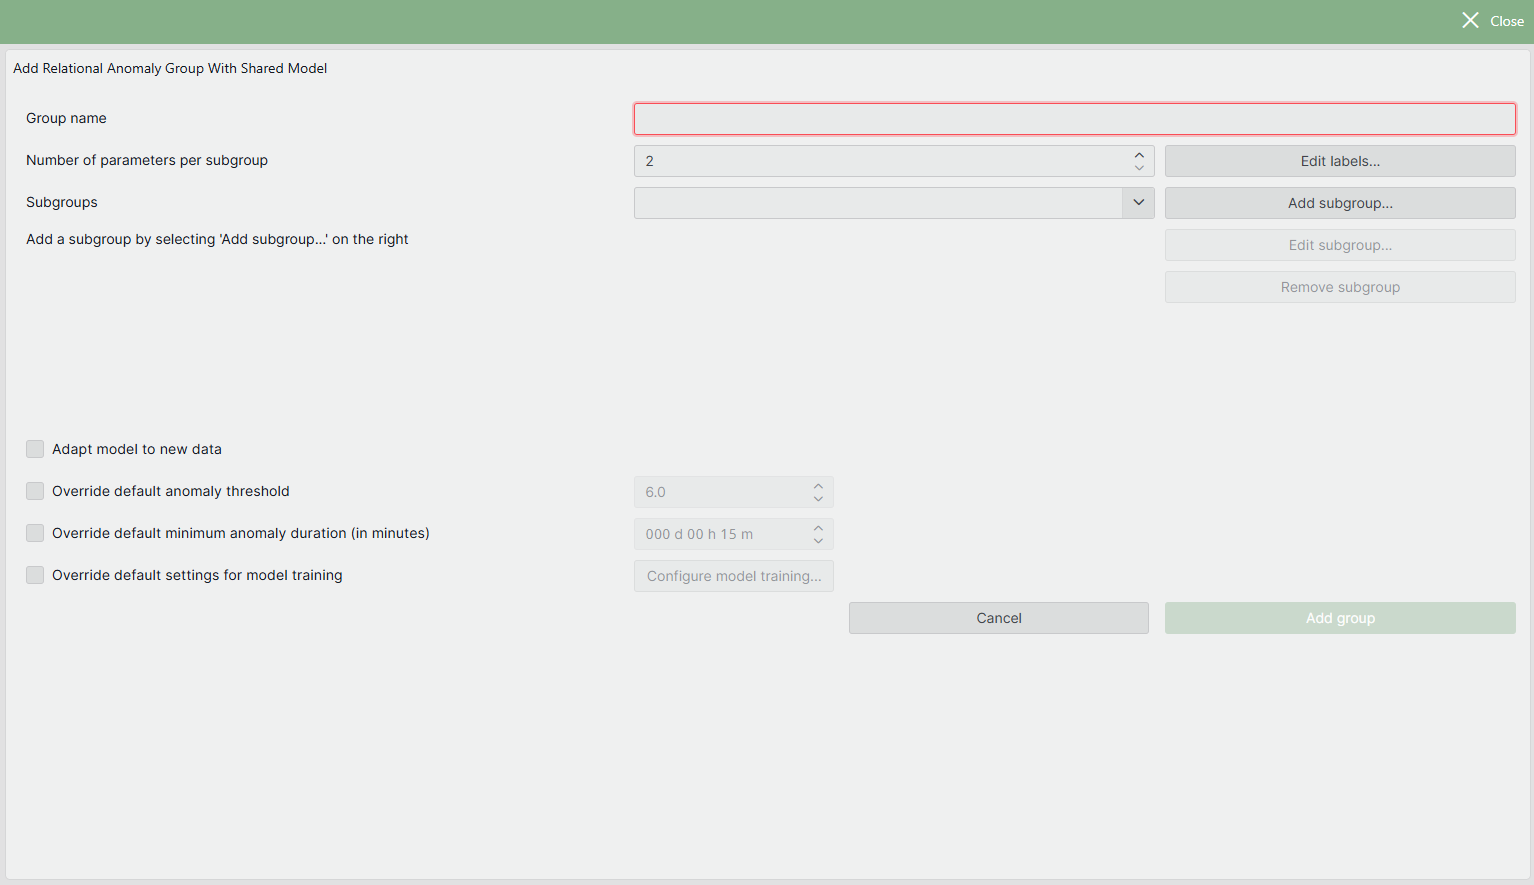
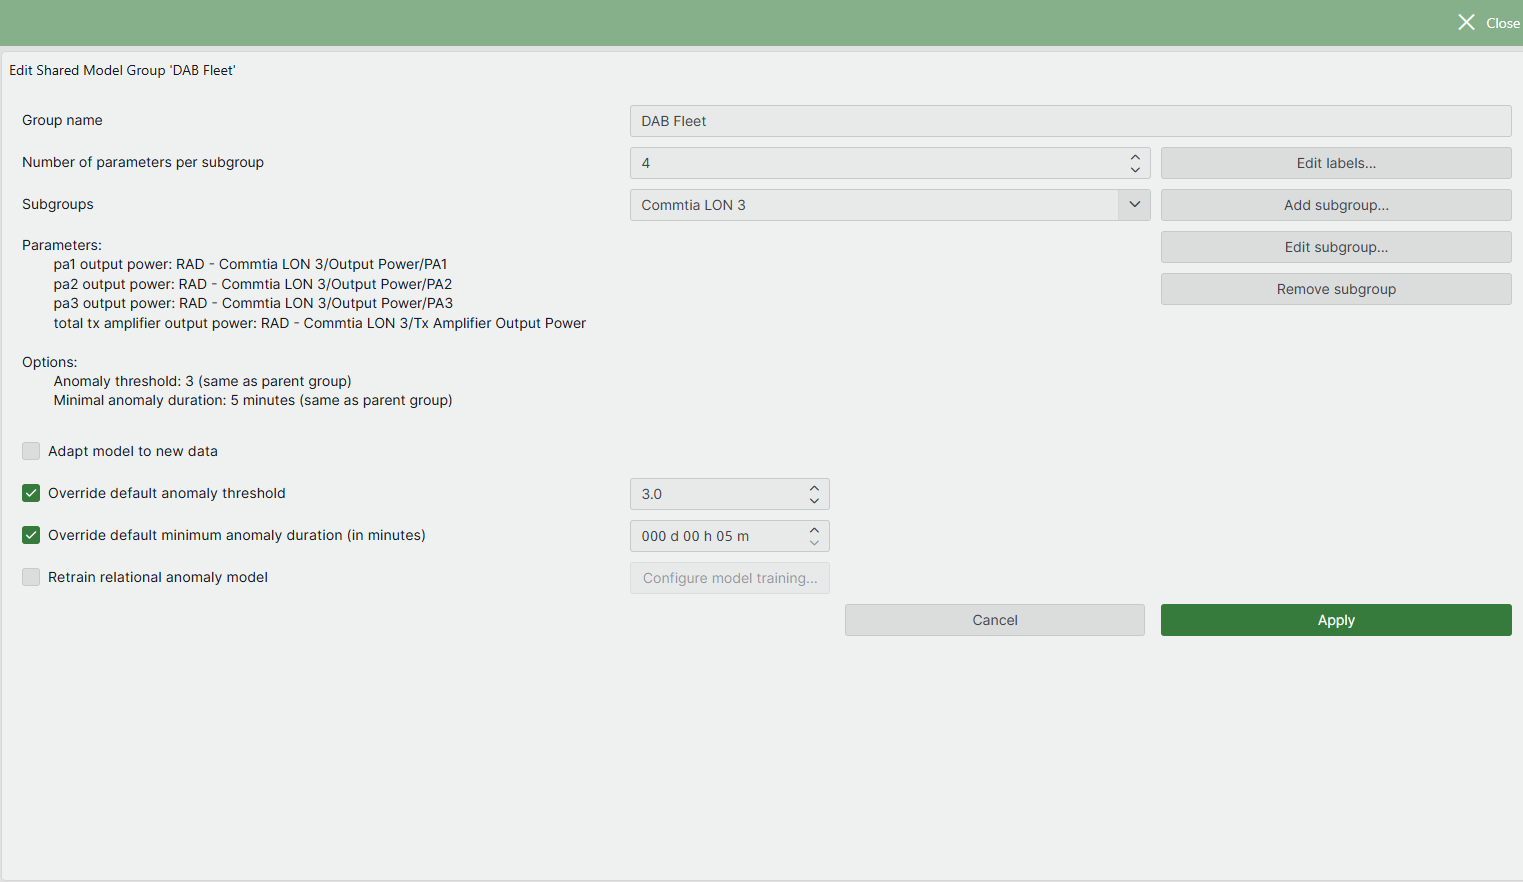
Set the Group name equal to DAB Fleet.
Set Number of parameters per subgroup to 4.
The group will monitor the Output Power of the three different power amplifiers and the Tx Amplifier Output Power.
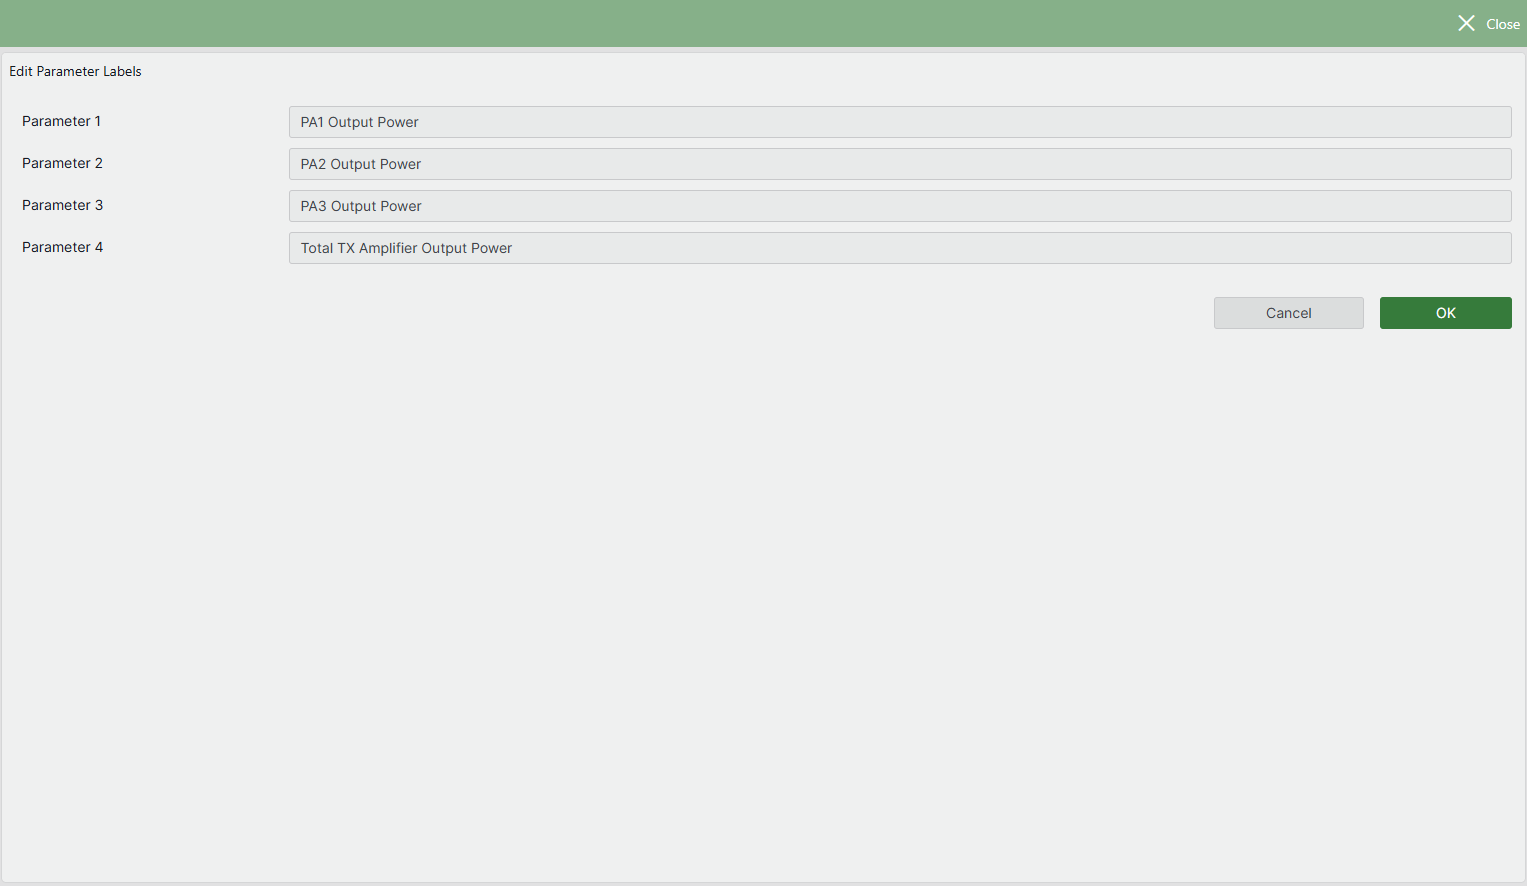
To get meaningful names for the parameters, click Edit Labels and assign meaningful names to each of the parameters, for example:
- PA1 Output Power
- PA2 Output Power
- PA3 Output Power
- Total Tx Amplifier Output Power
Click OK to close the labels editor.
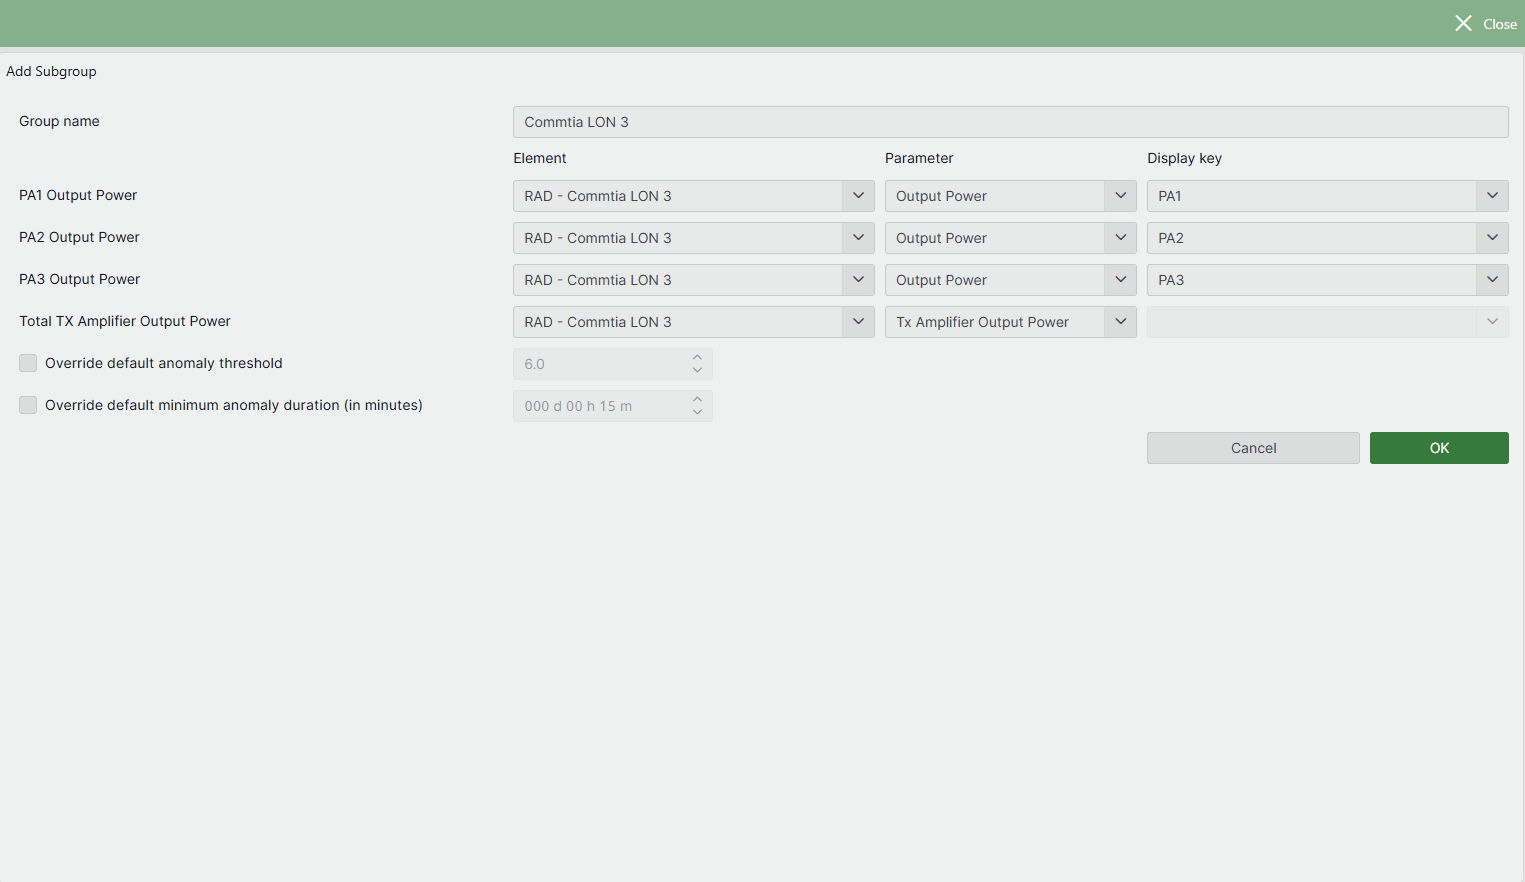
Click Add subgroup to add a first subgroup.
This will open a window where you can configure the parameters for this subgroup, which this time will be from the RAD - Commtia LON 3, RAD - Commtia LON 4, and RAD - Commtia LON 5 elements:
In the Group name field, fill in a meaningful name for the subgroup, for example Commtia LON 3.
In the row for the each Output Power parameter, select the element RAD - Commtia LON 3, select the Output Power parameter, and select the corresponding display key (for example, PA1 for the parameter PA1 Output Power).
In the Total Tx Amplifier Output Power row, use the RAD - Commtia LON 3 element and the Tx Amplifier Output Power parameter.
Leave the default anomaly threshold and minimum anomaly duration checkboxes unselected, so these are not overridden for this group.
Click OK to add the subgroup.
Click Add subgroup again to add a second subgroup, repeating the steps above, but this time with the RAD - Commtia LON 4 element and the subgroup name Commtia LON 4.
Click Add subgroup one last time to add the Commtia LON 5 subgroup, using the element RAD - Commtia LON 5.
The Subgroups dropdown will now contain the three subgroups you have defined. Selecting a subgroup will display its configuration.
As in Step 3, configure your RAD group with an anomaly threshold of 3 and minimum anomaly duration of 5 minutes.
As these settings are the same for each subgroup, you can configure the settings on the shared model group level. If necessary, it is possible to override settings for individual subgroups via the Edit subgroup button.
Click Apply to create the shared model group.
Optionally, select the shared model group to explore the subgroups underneath.
Test the new configuration in DataMiner Cube:
Go to the Demo Control page of say the RAD - Commtia LON 3 element and click Add Degradation.
Check the lightbulb icon in the Alarm Console to check that the relational anomaly was detected.
Check if the anomaly becomes visible in the RAD Manager.
If you do not immediately see it, refresh the RAD Manager page in your browser.
Step 7: Use the API to configure RAD groups
In case you have 100 DAB transmitters, it can be quite tedious to create single RAD groups for each of them manually. The creation of a shared model group has a similar problem as you need to add each subgroup one by one. To solve this, DataMiner provides a RAD API that allows you to create RAD groups programmatically.
In step 1 of this tutorial, two scripts were deployed that can be used for this:
The Add Single Groups script creates single RAD groups for all five RAD - Commtia LON elements.
The Add Shared Model Group script creates a shared model RAD group for all five RAD - Commtia LON elements
If you are interested in using RAD on your system, these scripts can be a useful example. They may seem complicated because of all the boiler plate code, but the only method that you really need to implement yourself is the RunSafe(IEngine engine) method. Feel free to use these scripts as a starting point for later if you decide to configure your own groups.
You can run the scripts as follows:
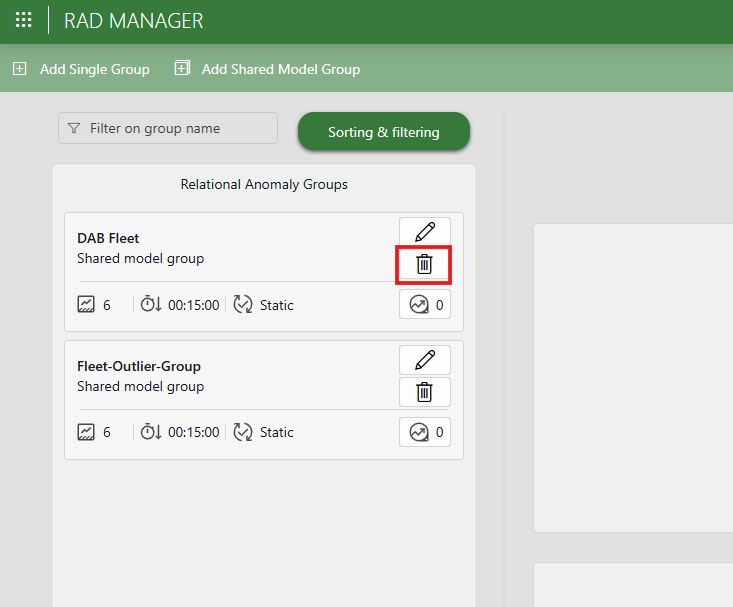
In the RAD Manager app, remove the groups you created during this tutorial using the garbage can icon next to each group name.
In Cube, go to Apps > Automation.
Select the script of your choice in the Automation script > DataMiner Catalog > RAD Demonstrator folder.
Tip
This is only one possible example of how you can use the RAD API. To create your own script to create a custom advanced configuration, refer to Working with the RAD API.
Step 8: Play around with the Fleet Outlier Radar
Shared model groups allow DataMiner to compare subgroups and identify when certain subgroups behave differently from the rest. To demonstrate this, use the Add Fleet Outlier Detection Group script to create a shared model group containing a larger number of subgroups.
In the Automation module, go to the Automation Scripts > DataMiner Catalog > RAD Demonstrator folder, select the Add Fleet Outlier Detection Group script, and execute it.
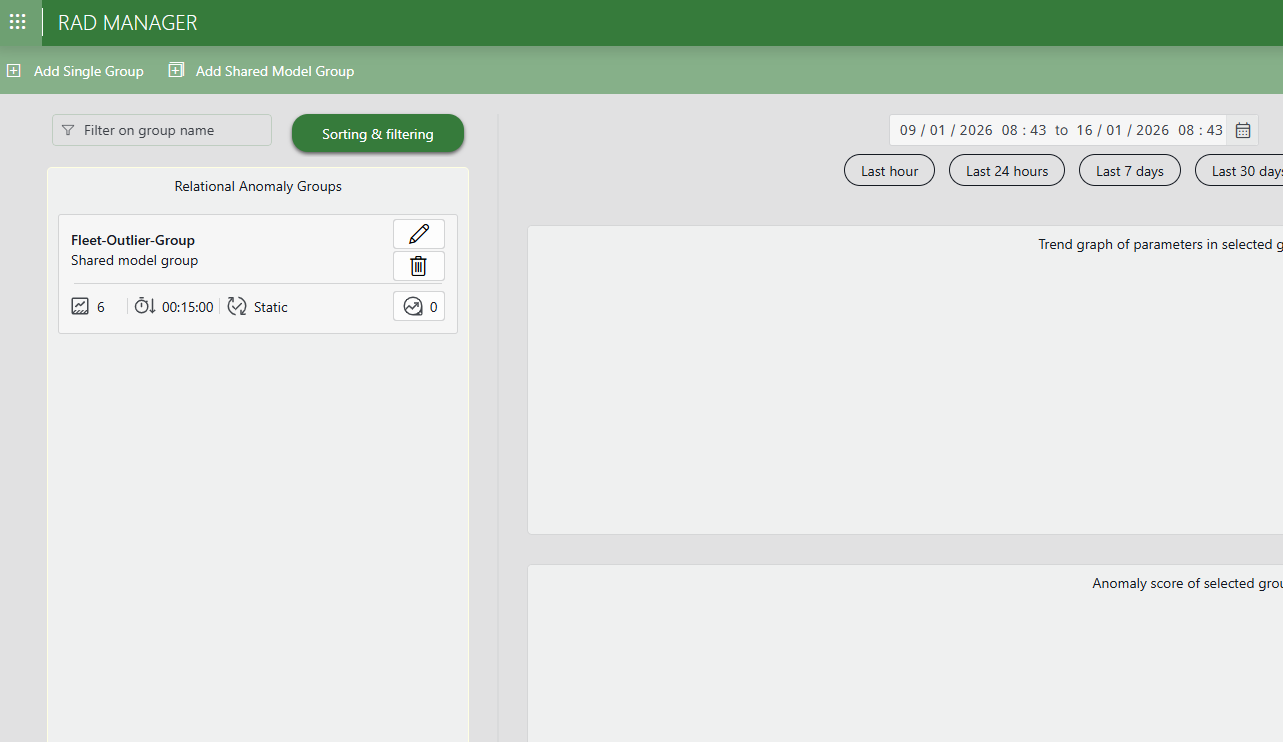
A new RAD group named Fleet-Outlier-Group is created on your system.
Note
It may take a short while for the group to be created and for all analysis results to become available. If the group or its results are not immediately visible, wait a moment and refresh the view if necessary.
In the RAD Manager app, select this new shared model group.
In the pane on the left, the group's subgroups (DAB transmitters) become visible. The group contains 13 subgroups with actual data collected in the field.
Scroll through the list and see if you find devices with the Outlier Group label.
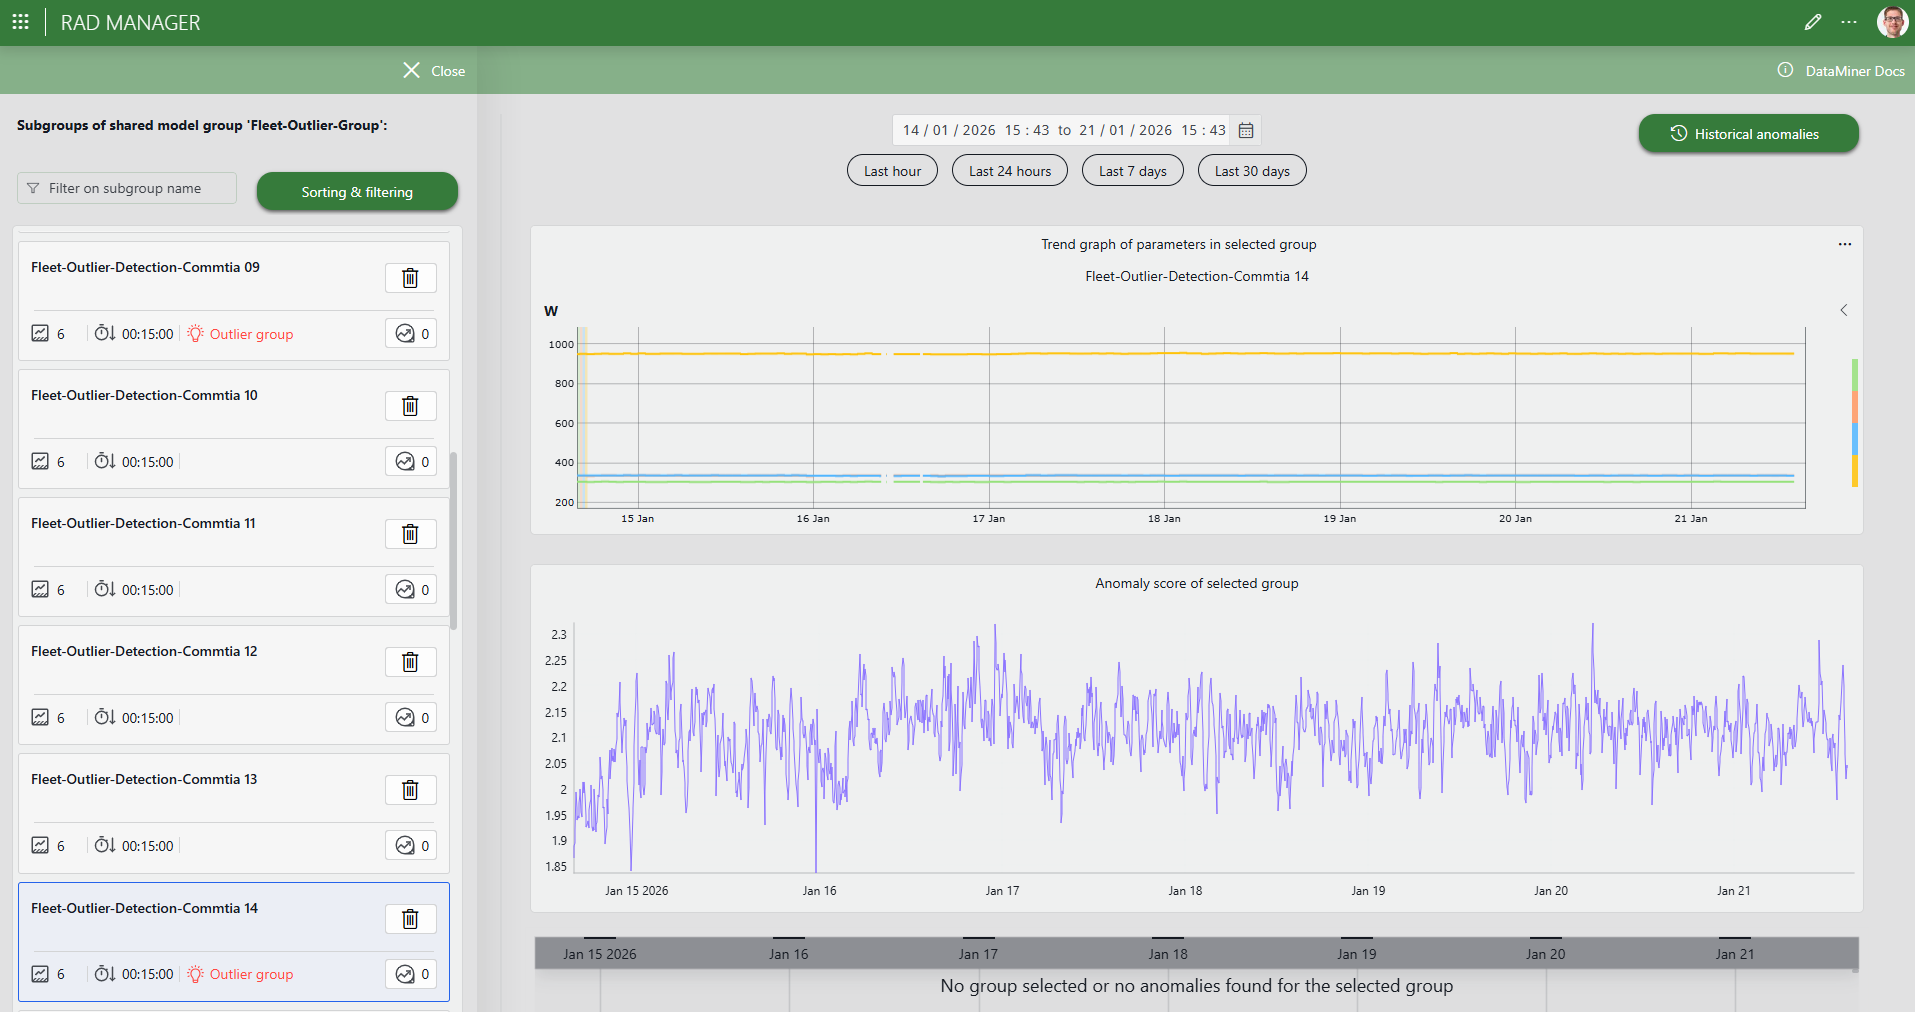
To quickly find a group with this label, you can use the Sorting & filtering button and select to sort by Is Outlier Group.
Select one of the subgroups. For example, in the outlier group shown below, the Output Power – PA1 differs from the other two PA output power values. This may indicate an issue.
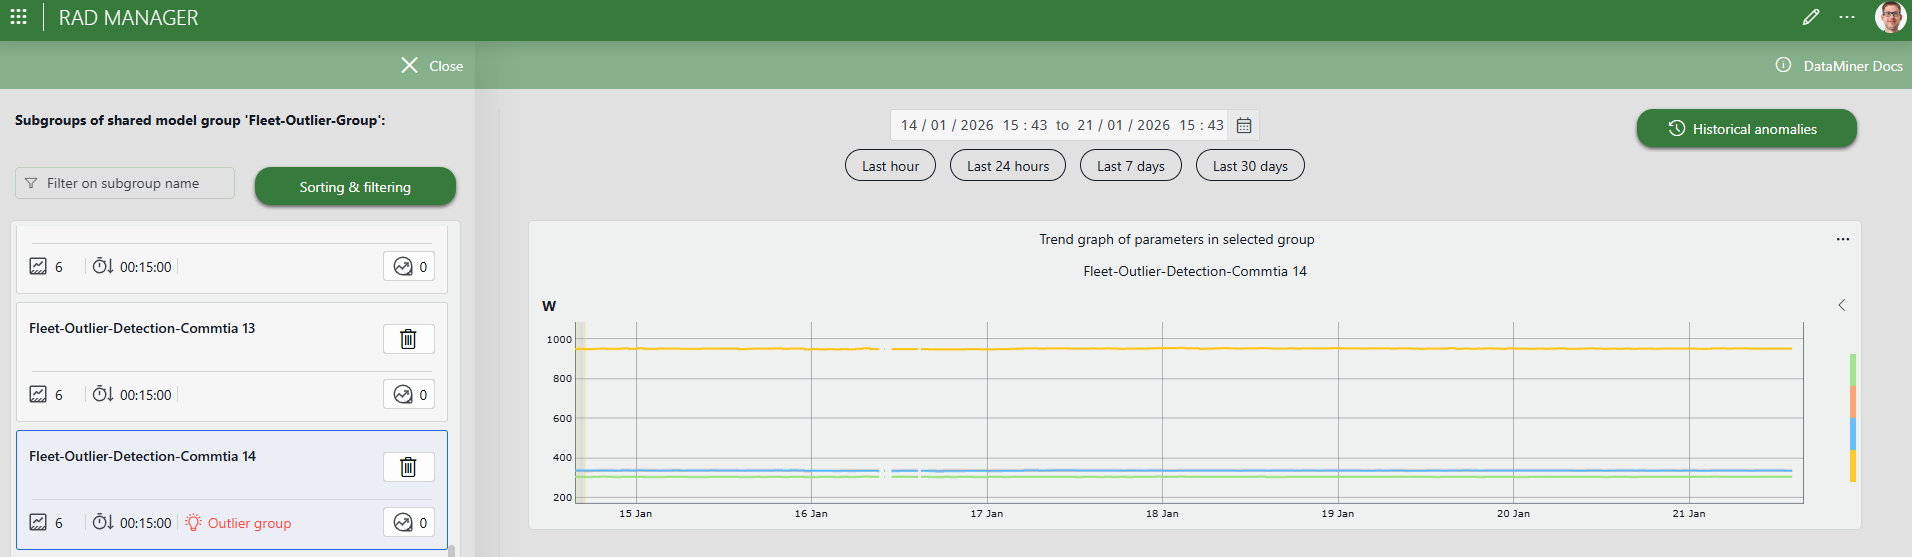
In another outlier group, the Total Tx Amplifier Output Power deviates more than usual from the sum of the output power values of the three individual power amplifiers.
Step 9: Clean up your system
In the RAD Manager, remove all the groups you created using the garbage can icon next to each group name.
Delete the elements under the DataMiner Catalog > Using Relational Anomaly Detection > London and RAD Fleet Outlier views in Cube.
Remove the AI - Commtia DAB and the Fleet-Outlier-Detection-Commtia DAB protocols under Apps > Protocols & Templates.
Remove the automation scripts under Apps > Automation > DataMiner Catalog > RAD Demonstrator.
In case you would like to repeat some of the exercises, you can instead duplicate the related elements or deploy the RAD Demonstrator package a second time, which will overwrite the existing elements.