About Visual Overview
DataMiner Visual Overview is a powerful, fully customizable graphical interface in DataMiner. It can be designed to display rich, real‑time visualizations of your operational ecosystem. Any part of your network can be graphically represented tailored to your specific needs, including any elements, services, and views in your system. You can also include alarms, video thumbnails, trend components, and much more.
Visual Overview pages can be fully interactive, ranging from simple parameter controls and buttons to complex control panels with sliders and rotating buttons, router control components, scheduling components, etc.
These pages can be found under the Visual node for element cards, service cards, and view cards. They are based on Visio drawings linked to the corresponding elements, services, and views. Assigning a Visio drawing with multiple pages will make all of these pages available under the Visual node in the card panel. For example, in our Ziine demo system, this multi-page Visual Overview illustrates the many possibilities of Visual Overview:
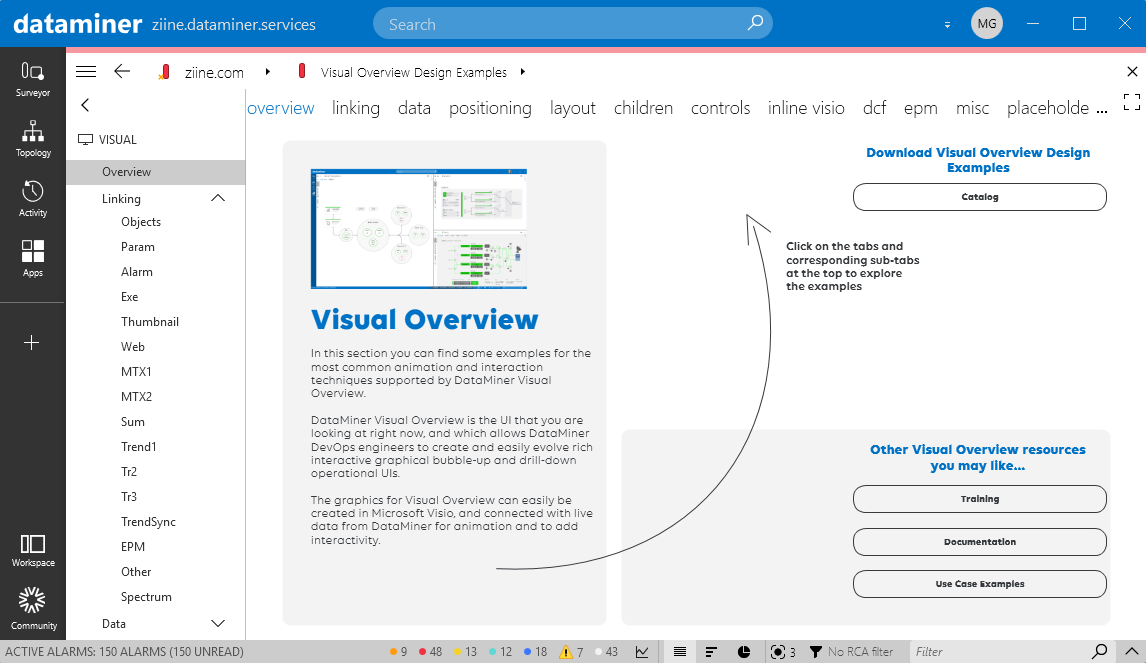
Ziine Visual Overview example (using DataMiner 10.6.2)
Tip
For an in-depth, detailed guide on how to design your own Visual Overview pages, refer to our Developer documentation.
Examples
Below you can see how Visual Overview can be used for an earth station shelter status overview.
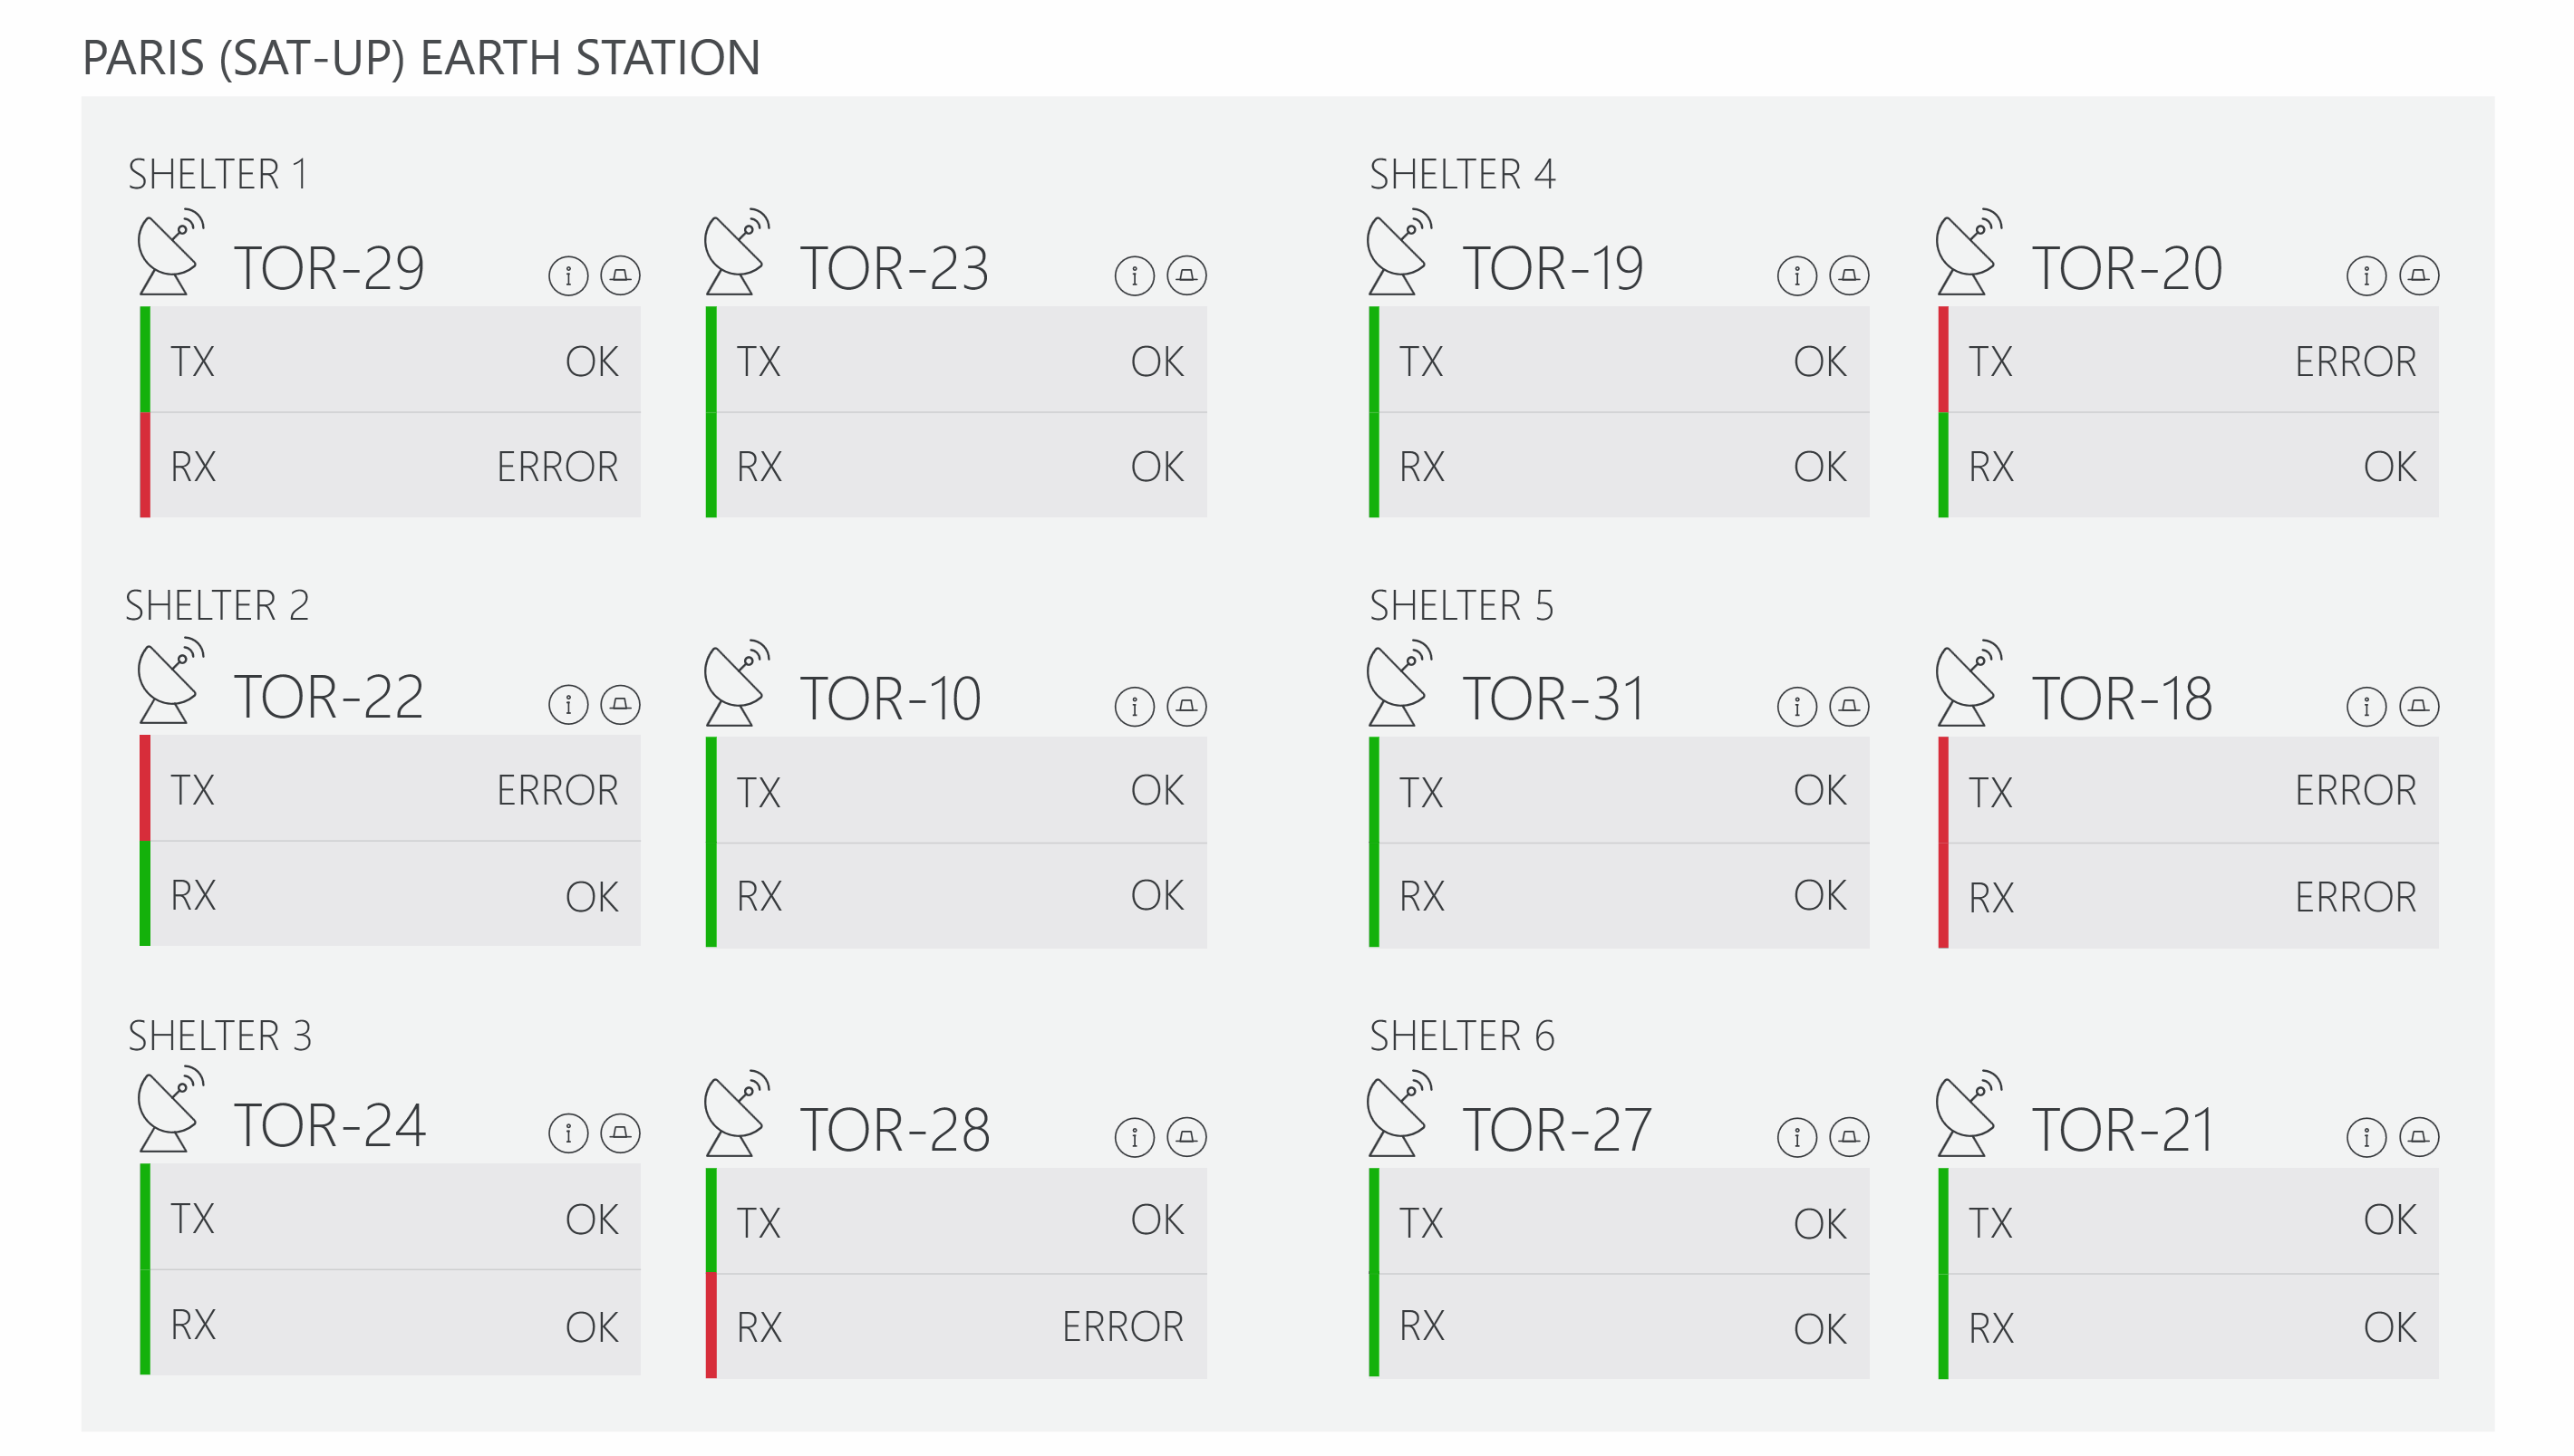
Tip
The Visual Overview shown above can be downloaded as a sample from our Catalog: Satellite Earth Station Uplink.
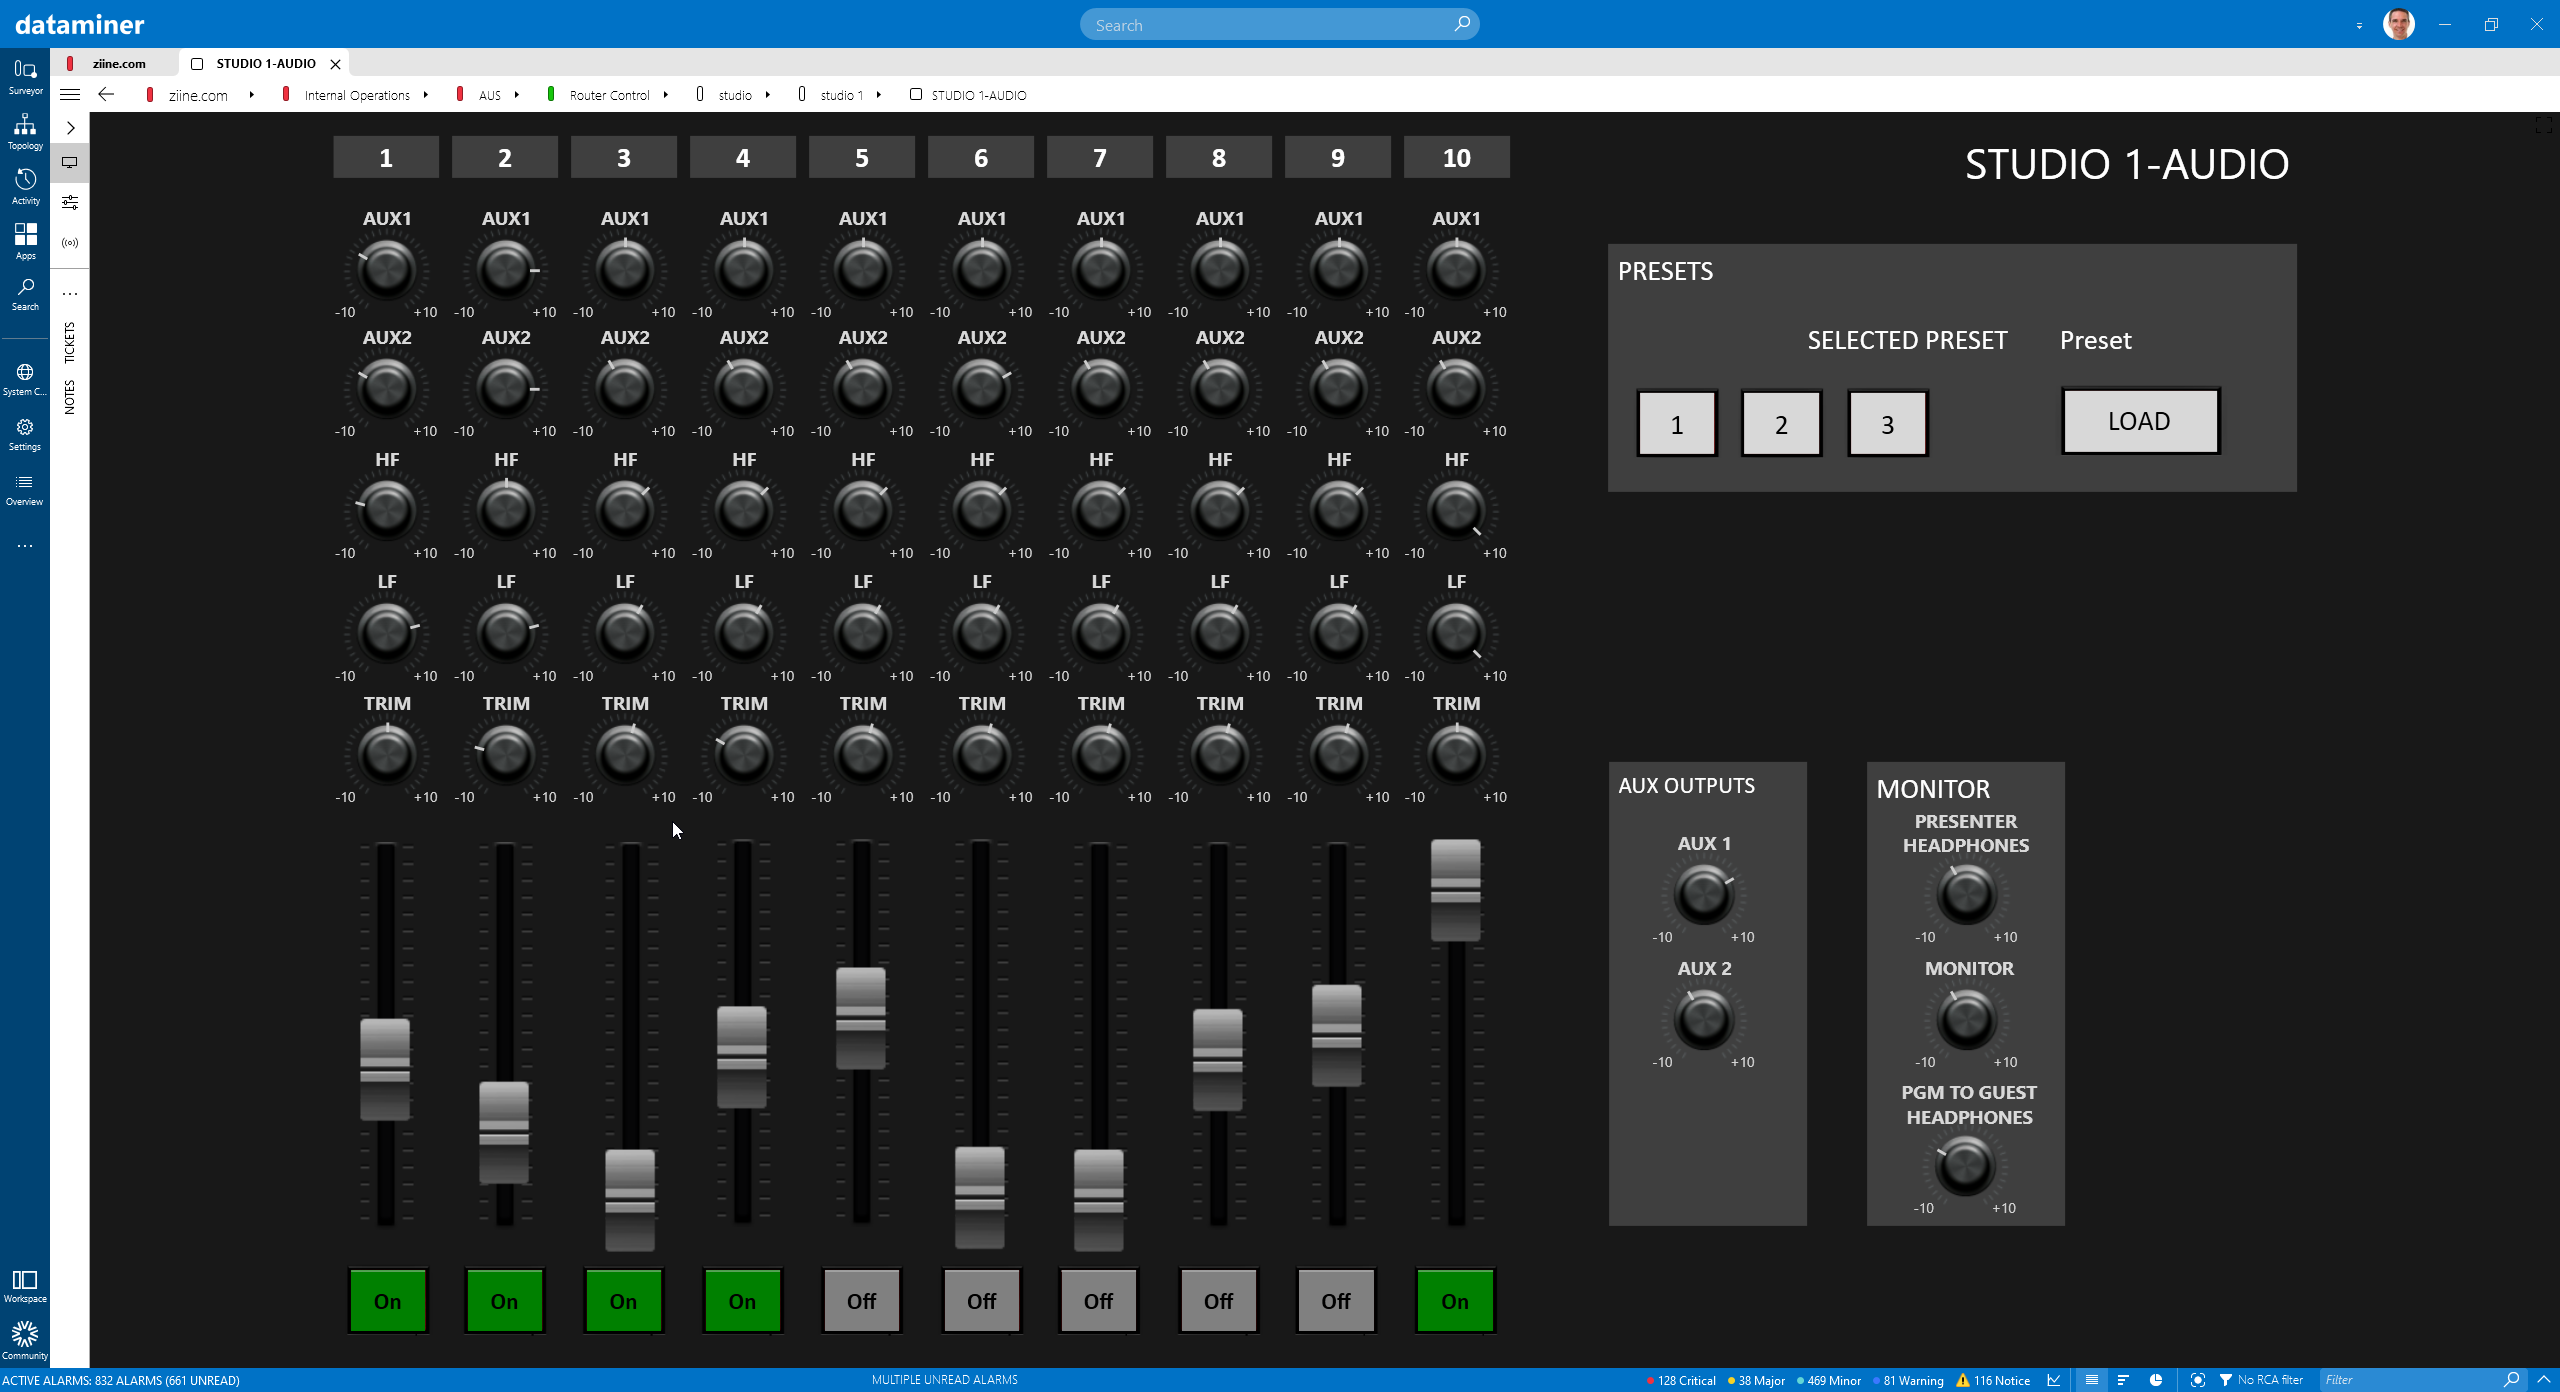
As shown in the Control Surfaces use case on DataMiner Dojo, you can create a fully customized control panel in Visual Overview:
For more examples, take a look at our use case library.