Creating your first element on a DaaS system
This tutorial guides you through creating your first Skyline Generic HTTP Query element. With this element, you will be able to monitor a website of your choice.
The content and screenshots for this tutorial have been created in DataMiner version 10.4.6.
Estimated duration: 15 minutes
Prerequisites
You must have a DaaS system.
You must have installed DataMiner Cube.
Overview
The tutorial consists of the following steps:
- Step 1: Deploy the 'Generic HTTP Query' protocol from the Catalog
- Step 2: Create an element to monitor a website of your choice
- Step 3: Create an alarm template for your element
- Step 4: Hide the unnecessary table columns (optional)
Step 1: Deploy the 'Generic HTTP Query' protocol from the Catalog
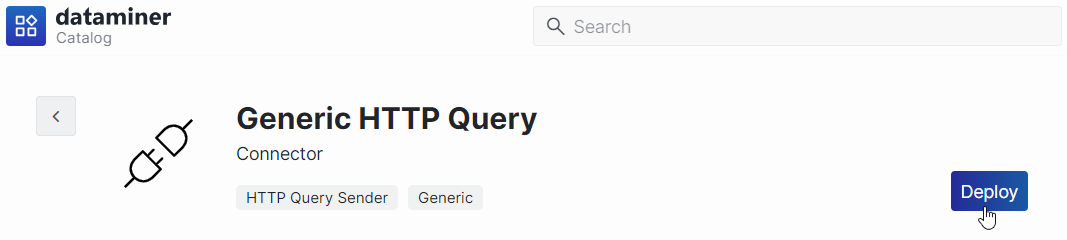
In this step, you will deploy the Generic HTTP Query protocol (also known as connector). This will allow you to create an element to monitor a website of your choice.
Look up the Generic HTTP Query connector in the Catalog.
Click the Deploy button.
Select the target DataMiner System and confirm the deployment. The package will be pushed to the DataMiner System.
Tip
See also: Deploying a Catalog item to your system.
Step 2: Create an element to monitor a website of your choice
Next, you will create an element that allows you to monitor a website of your choice, such as your corporate website. This element will use the Generic HTTP Query protocol you deployed earlier, which can be used to regularly send HTTP/HTTPS requests. This helps assess the website's availability.
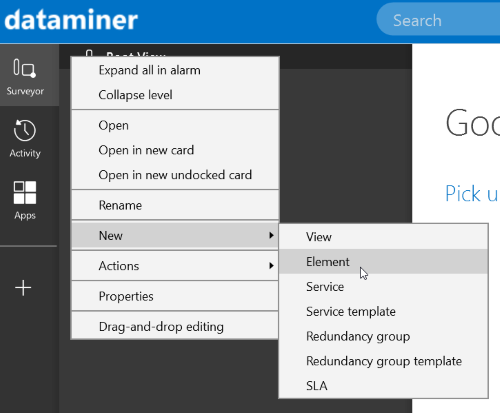
In the Cube sidebar, right-click in the Surveyor and select New > Element.
A card will open.
Specify the following information:
General > Name: Enter a name for your element, e.g.,
My corporate website.General > Description: Enter a description for your element, e.g.,
Element to monitor a website's responsiveness.Device details > Protocol:
Generic HTTP Query.
Click Create to add the element.
Tip
See also: Adding elements
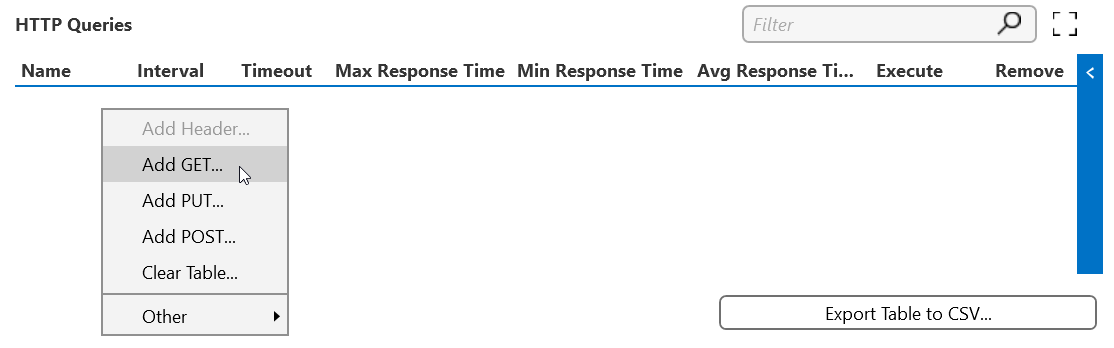
On the DATA > General page, right-click the HTTP Queries table and select Add GET.
Provide the following information:
URI (HTTP Queries): Enter the hostname of your chosen website. Use this format:
http(s)://[address], e.g.,https://www.skyline.be.Interval (HTTP Queries): 10 s.
The HTTP query will be executed every 10 seconds.
Timeout (HTTP Queries): 900 s.
The system will wait 900 seconds for a response from the remote server after an HTTP query is sent. If the server does not respond within this time frame, the query is considered failed.
Name (HTTP Queries): Enter a name for your entry, e.g.,
Skyline.
Select OK in the lower-right corner.
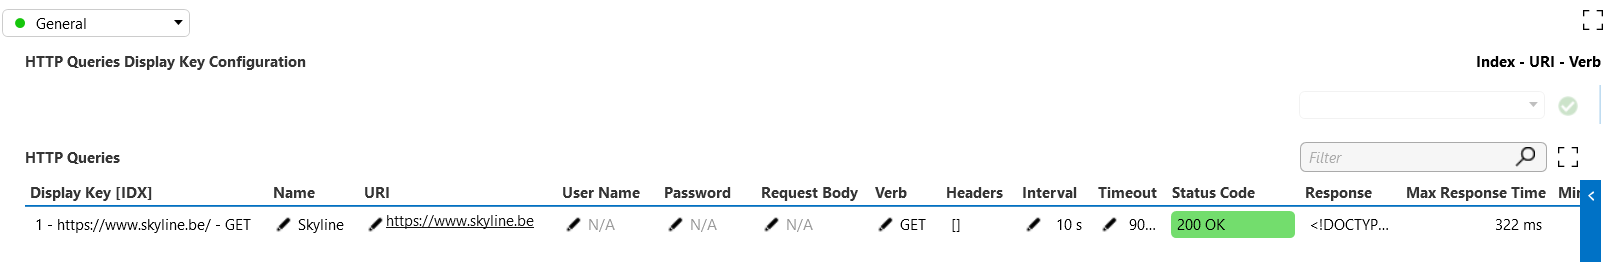
A new entry has now been added to the HTTP Queries table on the DATA > General page of your element.
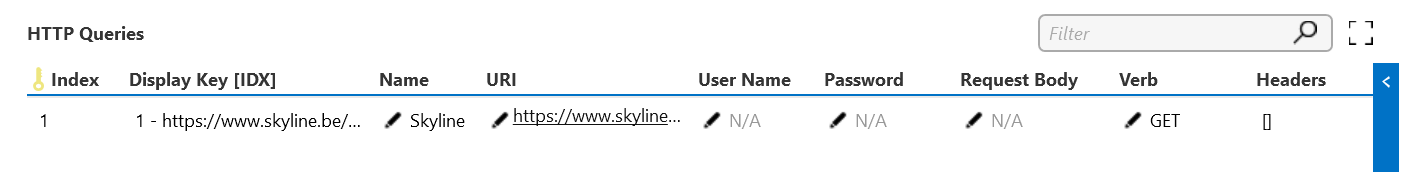
You have now created an element to monitor the status of a website. By default, a HTTP/HTTPS request is sent out every 10 seconds.
Step 3: Create an alarm template for your element
To monitor the website's availability effectively, you will focus on the HTTP response status code in the Status Code column. These codes are grouped into five categories based on their first digit, each representing a different class of response:
| Category | Type of response | Example |
|---|---|---|
| 1xx | Informational | 102 Processing: The server has received and is processing the request, but no response is available yet. |
| 2xx | Success | 200 OK: The request was successful. |
| 3xx | Redirection | 301 Moved Permanently: The requested resource has been permanently moved to a new URL. |
| 4xx | Client errors | 404 Not Found: The server cannot find the requested resource. |
| 5xx | Server errors | 502 Bad Gateway: The server, while acting as a gateway or proxy, received an invalid response from the upstream server. |
Tip
For an overview of all status codes, see HTTP response status codes.
A status code in the 2xx category indicates a successful response. All other codes should trigger a warning or critical alarm.
In this final step, you will create an alarm template to monitor the Status Code parameter.
Look up your newly created element in the Cube Surveyor.
Right-click the element and select Protocols & Templates > Assign alarm template > New alarm template.
In the new alarm template pop-up window, enter a name for your template and click OK.
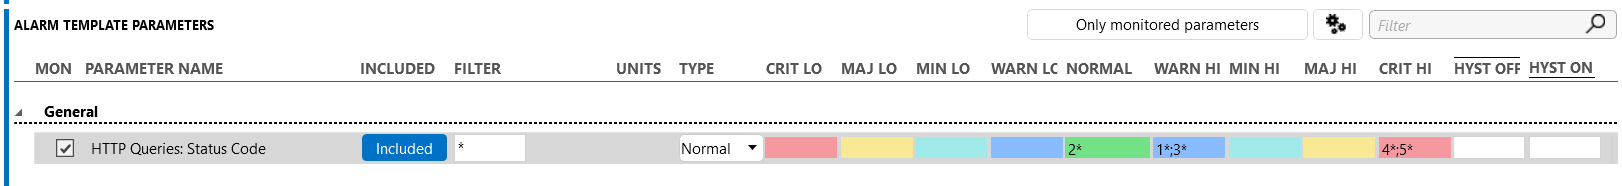
Under General, select the HTTP Queries: Status Code parameter.
Configure the following alarm thresholds:
In the NORMAL column, enter
2*.In the WARN HI column, enter
1*;3*.In the CRIT HI column, enter
4*;5*.
With this configuration, if the HTTP response status code in the Status Code column starts with a 1 or 3, a Warning high alarm will be triggered. If a status code starts with a 4 or 5, a Critical high alarm will be triggered.
Select OK in the lower-right corner.
On the DATA > General page of your element, the alarm severity will now be shown with appropriate colors for the Status Code column.
You are now monitoring the Status Code parameter. If a warning or alarm is triggered for your chosen website, it indicates an issue that should be investigated.
Step 4: Hide the unnecessary table columns (optional)
By default, the HTTP Queries table shows a lot of columns that are not useful for this tutorial. In this step, you will hide these to get a cleaner view on the data.
Right-click the top row of the table and hover the mouse pointer over the Columns option until it expands to show all columns in the table.
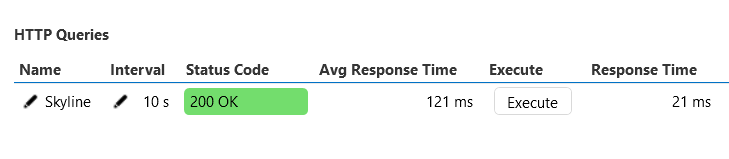
Clear the selection from all columns except Name, Interval, Status Code, Avg Response Time, Execute, and Response Time.
At the bottom of the menu, select Save layout.
Only the Name, Interval, Status Code, Avg Response Time, Execute, and Response Time columns will be displayed now.
If you just want to discover some of the things DataMiner can do, deploy some demo solutions. If you want other users to be able to use your DaaS system, add these users and configure their rights in System Center.
