Manually applying an alarm filter in an Alarm Console tab
In the Alarm Console, you can add extra tab pages where you can specify a custom alarm filter.
To add such a filtered tab page:
Click the + symbol in the header of the Alarm Console.
Choose Apply filters or Apply filter and window size, depending on whether you want to see current alarms or history alarms, or alarms in a sliding window.
Specify the time for which alarms need to be retrieved:
For active alarms, skip this step.
For a history alarms, in the From and To boxes, specify the range for which alarms need to be displayed.
For alarms in a sliding window, specify the window size (between 1 minute and 1 day). The default window size is 60 minutes.
Click Select a filter to create or select a filter, then select the field you want to filter on.
Applying an alarm filter in an Alarm Console tab in DataMiner 10.4.5Note
If any filters have been saved on your DMS, you will be able to choose them in this step. See Working with saved alarm filters.
If you create a new filter, you will then need to specify it further, possibly using a wildcard expression or regular expressions.
Note
- For more information on using wildcards or regular expressions in filters, see Using wildcards or regular expressions in alarm filters.
- To filter the Alarm Console based on a Visual Overview session variable, create a new filtered tab displaying current alarms, and create a filter using Matches wildcard expression, Does not match wildcard expression, Matches regular expression, or Does not match regular expression. In the second part of the filter, specify the variable, in the same way as in Visio, e.g., [var:LoadTime]. For more information, see [var:VariableName].
- If you create a Services filter in a history tab, and you want to include services that have been deleted, at the bottom of the box where you can select services to filter on, select the Load deleted services checkbox (available from DataMiner 10.2.0/10.1.4 onwards).
If you want, you can also combine several filters, using logical operators (AND, OR).
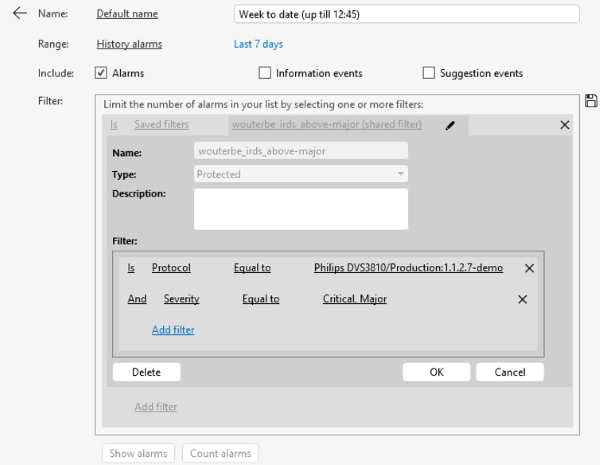
Optionally, limit the types of alarms displayed in the new tab by selecting or clearing the Alarms, Masked alarms and/or Information events checkboxes. These allow you to for example only display information events in the new tab.
Optionally, click Count alarms to check how many alarms will be shown when the tab configuration is applied.
Note
- If you chose to display history alarms, the Count alarms option will only work with certain filter combinations. If you configure a filter combination for which the option is not available, a notification message will appear.
- From DataMiner 10.1.0 [CU8]/10.1.11 onwards, when you create a tab to display history alarms or alarms in a sliding window, for filters on element type, interface impact, parameter description, protocol, service impact, view ID/impact/name, or virtual function ID/impact/name, the Count alarms option is no longer available.
To see the filtered alarms in the Alarm Console tab, click Show alarms.
If you want to change filter settings after the filter has been applied, click the pencil icon next to the alarm tab name.