Debugging connectors: Seeing through the smoke
This rather complicated use case focuses on an issue with the Cisco Manager connector (v5.1.1.83). In a large DMS where the connector had been installed for 7 years and remained without updates for 2 years, RTEs started showing up and continued to appear for months. First there were half-open RTEs, and then this changed to full RTEs.
To investigate this, we will among others make use of the SLNetClientTest tool. Please keep in mind that this tool should always be used with caution, as it can have a big impact on the functionality of the DataMiner System. We recommend to only perform the specified operations, and to only use this tool on a DataMiner Agent that is dedicated to testing. Always ask for support in case you need to use this tool and something is not clear.
Investigation
“It is of the highest importance in the art of detection to be able to recognize, out of a number of facts, which are incidental and which vital. Otherwise your energy and attention must be dissipated instead of being concentrated.” – Sherlock Holmes
Starting point: SLWatchDog2 logging and Alarm Console
Let’s start by observing the problem. We have both the SLWatchDog2 logging and the Alarm Console showing RTEs as an initial source of information.
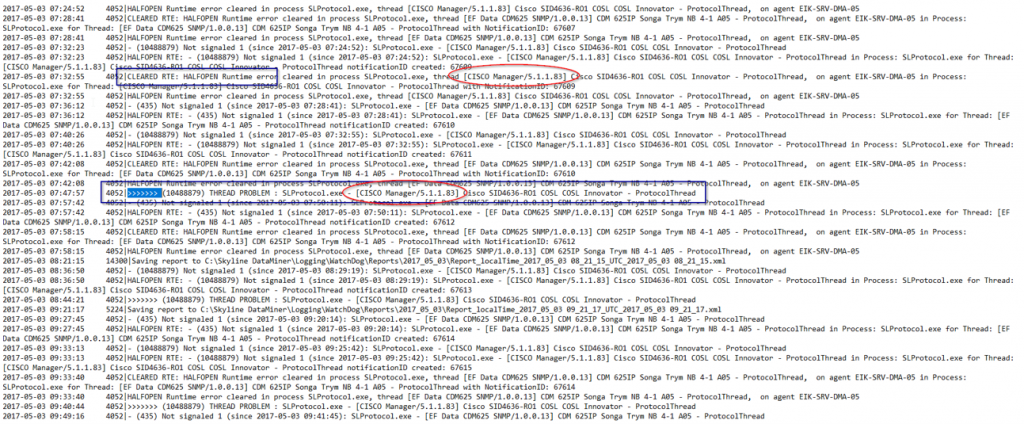
At first sight, this logging looks like a wall of text. It looks like several other elements are also showing issues, but for now we need to focus on the reported issue only. So we need to filter on “Cisco Manager”. That is when something strange becomes clear: there are both elements with half-open RTEs that clear themselves and elements with a full RTE.
We will focus on the most critical problem first: the full RTE. This is also visible in the Alarm Console.
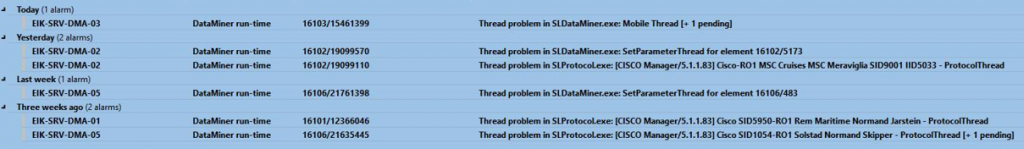
However, there you will see there is not just an RTE for the protocol thread in SLProtocol.exe, but also for the SetParameterThread in SLDataMiner.exe. Both RTEs are related to the element running the Cisco Manager connector.
Checking the pending calls
Let’s check another data source that can have vital information related to RTEs: the pending calls. Using the SLNetClientTest tool, you can check which groups and timers are active in which threads for an element (see How to retrieve protocol pending calls?).
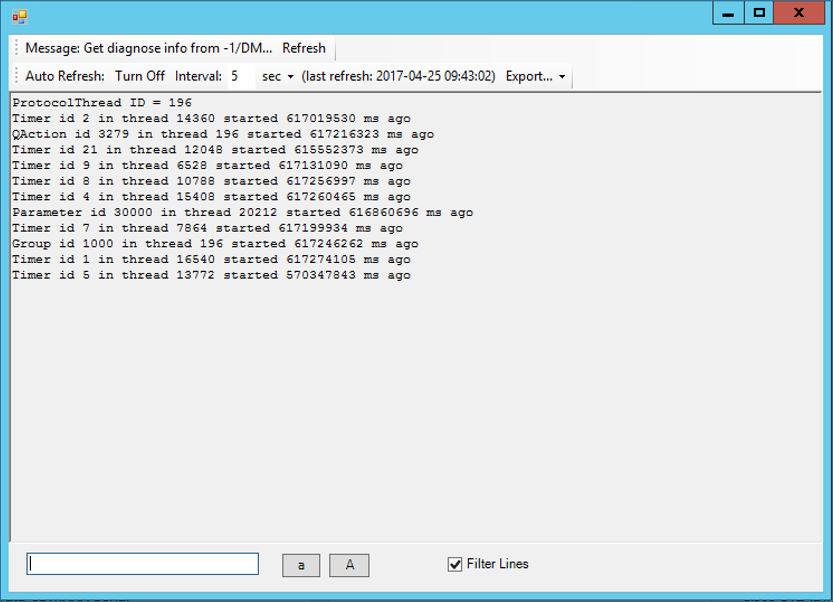
The first thing in the pending calls that should always catch your eye is if a QAction is mentioned. In the vast majority of cases, that QAction will be the cause of the RTE. Another thing you can do is sort the rows based on the “Time started” and ignore the timers:
>    Group 1000 | 617 246 262 ms
>    QAction 3279 | 617 216 323 ms
>    Parameter 30 000 | 616 860 696 ms
In this case, this is what we can learn from this:
The RTE has been ongoing for over 7 days.
QAction 3279 is stuck.
Parameter 30000 is stuck.
The SetParameterThread RTE
Parameter 30000 is related to the SetParameterThread. A quick check of this parameter in the Protocol.xml shows that it is a page button:
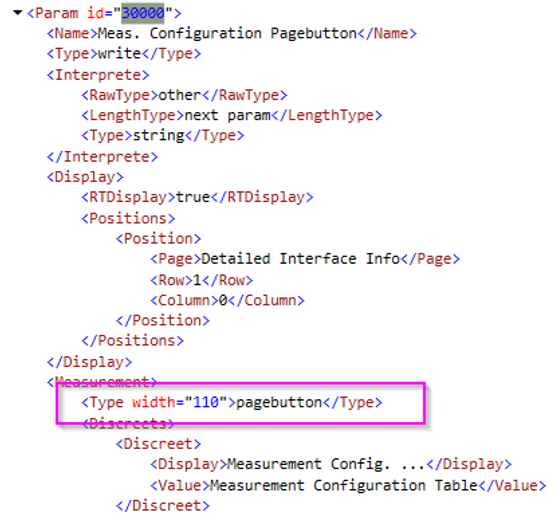
This gives us an explanation for the RTE in the SetParameterThread. It is in fact not a “cause” or a “clue” in our investigation, but an effect. Something caused the protocol thread to have an RTE. Then someone clicked this page button, but the SetParameterThread could not finish the request because of the protocol thread RTE. The good news is that we can therefore completely ignore the SetParameterThread RTE for the rest of our investigation, as it is only there because there already was a protocol thread RTE.
This means that we are left with these facts:
Some elements using this same connector and version have half-open RTEs that clear up by themselves.
Some elements using this same connector and version have full RTEs that last for days.
QAction 3279 has been stuck for over 7 days and will not finish.
Deadlock or livelock?
The logical next step is to take a look at QAction 3279. However, it turns out to consist of many lines of code, so it will take a lot of time to debug completely. To make matters worse, we do not have enough data yet to pinpoint where to look. So at this point, we need more data.
“Data! Data! Data! I can’t make bricks without clay.” – Sherlock Holmes
The big question of course is where to find more data sources. For this, we need to keep in mind that when full RTEs do not clear up, there are usually two ways something can be stuck:
A deadlock, which means something is just waiting for something else indefinitely and not doing anything else.
A livelock, which means a process triggers a change in another process that triggers the original process again, over and over, ad infinitum. This is also called an infinite loop.
In case our problem is caused by a livelock, this means the process is constantly “busy”. The logical place to investigate something that is always busy on a computer is the Task Manager. So let’s take a look there.

Eureka! SLScripting.exe is running at 25%. That is one entire core of this server. This means we have a new clue to add to our list:
Some elements using this same connector and version have half-open RTEs that clear up by themselves.
Some elements using this same connector and version have full RTEs that last for days.
QAction 3279 has been stuck for over 7 days and will not finish.
SLScripting is constantly busy (livelock) with a full CPU core.
A closer look at QAction 3279
This extra clue gives us something to focus on when we look at QAction 3279, as there are only a limited number of scenarios that can cause a livelock situation. These are the most common scenarios:
Infinite While loop
Infinite recursion
Foreach loop, adding to the source collection
For loop incorrect iterator
Property setting or getting itself
Setting a parameter that retriggers the same QAction
So we can now search through the code using Ctrl + F with the following keywords “While”, “Foreach” and “For”. While “While” and “Foreach” yield no results, we get several hits for “For”. When we pinpoint the “For” loops and take a closer look, something quickly catches the eye: int j = 6 ; j < 18 ; i++
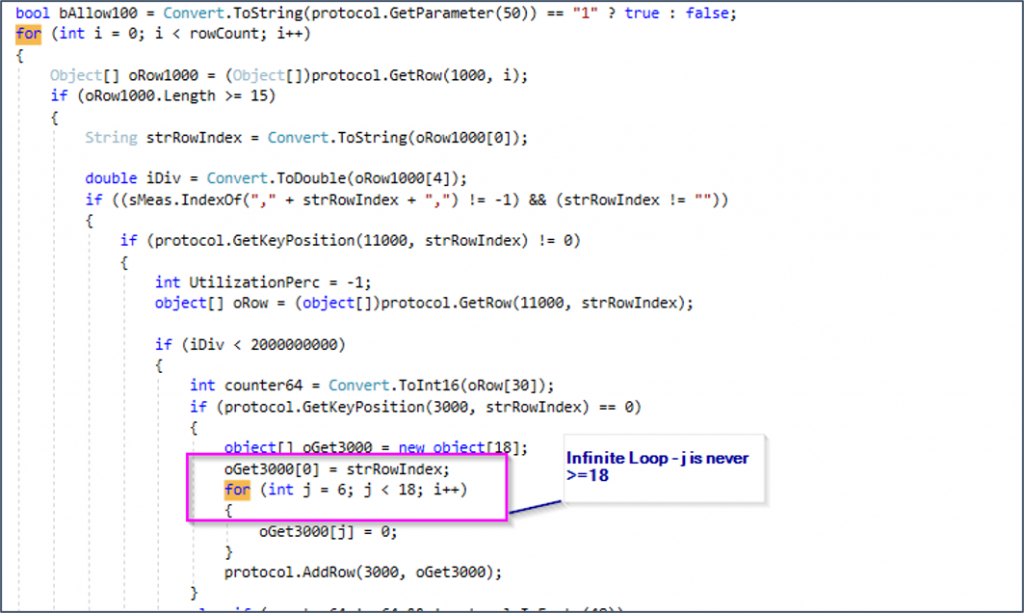
This loop has an iterator bug. It defines “j”, then says to loop as long as “j” is smaller than 18, but then increases “i” instead of “j” with every loop. This loop will never exit.
It should be noted that if our current automatic analysis tools are used, a bug like this will be caught during development. However, in this case the bug is caused by an old piece of code that went unnoticed for many years, because the infinite loop only occurs when very specific conditions are met (“if” checks). This explains why some elements get the RTE, but not all of them. It also explains how the issue can suddenly appear out of the blue while nothing has changed in the system.
A second issue
One problem still remains, though: what about the half-open RTEs that get cleared? These cannot be explained with this loop, because a loop like this does not get resolved. All our other clues are resolved with the loop we discovered, but this problem remains. This means we are probably dealing with a second issue!
Time to rinse and repeat: for this second issue, we will need another data source. If half-open RTEs get cleared up, this means something takes a long time (> 7.5 minutes) but finishes before it can become a full RTE (15 minutes). This usually means that one of the following things is happening:
The data is processed inefficiently and slowly.
Too much data is handled at the same time.
A combination of both.
SLProtocol RowCount
To check if too much data is being handled, you can do an SLProtocol RowCount using the SLNetClientTest tool:
Open SLNetClientTest tool from the DataMiner Taskbar Utility by selecting Launch > Tools > Client Test.
Connect to the DataMiner Agent by selecting Connection > Connect.
Go to Diagnostics > DMA > Parameter Table Rows(SLProtocol).
First enter the DMA ID, then leave the element ID empty. The information then will be displayed in the Output tab.
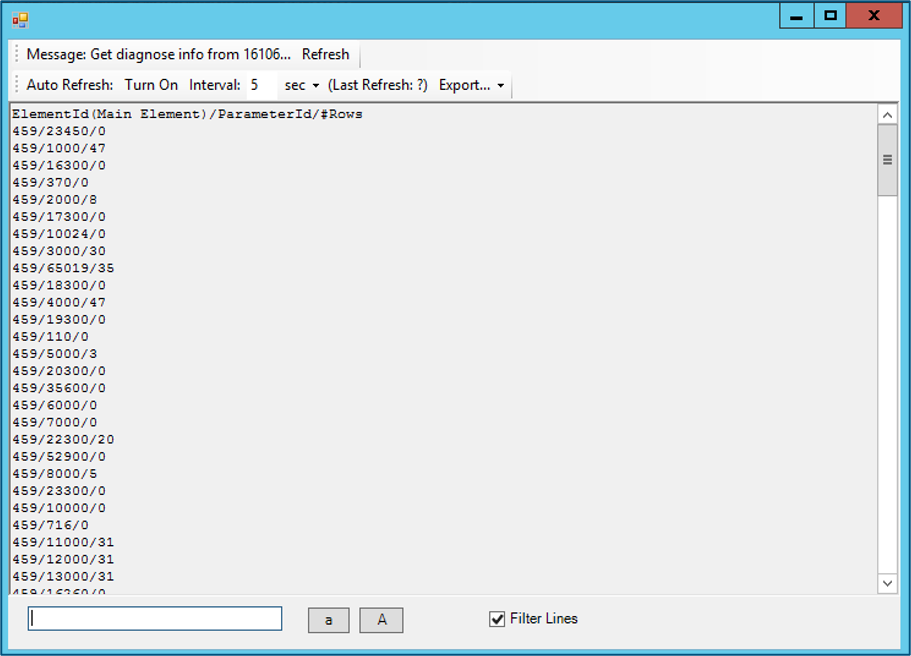
If we combine this with the Protocol.xml data source and the column counts, this is what we find:
433/1000/128 (20 columns)
433/4000/128 (18 columns)
433/31000/128 (6 columns)
433/34000/128 (3 columns)
433/17550/129 (2 columns)
433/41000/128 (8 columns)
We find that one of the largest tables (in all elements) has around 2560 cells. Based on experience, we can tell that this is not enough data to cause this issue, so inefficiency is more likely to be the cause. An additional complication is that during the time we were able to observe the system, no half-open RTEs occurred, so we cannot take a look at the pending calls. If we had been able to do so, we would have been able to check whether the cause was a QAction.
The last resort: trial & error
This means we are left without further facts to use as a basis for deductions. At this point, we can only presume several scenarios and go for trial and error to see which one applies. This is far from ideal, but we are left with no other option.
Given that the largest table has about 2500 cells and is an SNMP table, there are several ways this could be handled inefficiently:
The QAction code that parses this data could do so very inefficiently. This could be the case if the code triggers other actions or does something slow like accessing files.
The SNMP polling for the full table could take longer than 7.5 minutes.
Now if we look at the QAction code, we only see CPU-bound work. As this is extremely fast, this is unlikely to be the cause of the inefficiency. So let’s focus on the SNMP polling instead, and try a few tricks.
The first thing we can try is adding the partialSNMP option to the table. This splits table polling into many virtual groups and internally polls group per group, so that SLWatchdog does not detect an RTE for a single large group. However, the results from this test turned out to be inconclusive.
The second thing we can try is reduce the timeout times in the element configuration. This can be a fix for networks where the network speed fluctuates between good and bad. During network congestion, it can sometimes be better to “give up” more quickly as all the retries will keep failing anyway. If you “give up” the whole polling cycle, you can wait for the next cycle when the connection is hopefully more stable again.
The second trick solved the problem: after reducing the timeout times, no more half-open RTEs occurred.
Conclusion
This case turned out to be two issues disguised as one.
The full RTE was caused by a bug in the connector. More specifically, it was caused by a very old piece of code that had never run before. It was fixed with a new version of the connector.
The half-open RTE was caused by network congestion and the retries and timeout of the larger SNMP tables. This was fixed by reducing the timeout times of the elements, though this can cause a delay to the data.
Tips & tricks
A single system can have several unrelated problems that are reported at the same time. Try to single out each issue and tackle them one by one.
Some clues can point at causes of the issue, but others can be an effect. Figure out which is which to filter out the noise.
To help pinpoint the problems, consider checking the logging, pending calls, row counts and Task Manager in addition to the connector code itself.
Only when no other options are available, presume likely scenarios and use trial and error to find out which scenario applies.
For more use cases related to runtime errors, see Protocol thread runtime errors: use cases.