Protocol thread runtime errors: use cases
This article dives deeper into different use cases where protocol thread runtime errors occur. First, a couple of general concepts are explained that will be useful to fully understand the use cases, then 5 use cases are explained in detail. These may help you in protocol thread RTE investigations, and also contain useful lessons on how to avoid RTEs.
General concepts
Protocol threads
Protocol threads are the main threads of an SLProtocol process and are used to execute groups with requests towards an external destination (e.g., a device). Each thread can run 1 group at a time, maintaining a priority queue of the other groups to execute. Each group can be composed of triggers, actions, polling parameters and/or QActions.
By default, there is one protocol thread in an SLProtocol process and there are five SLProtocol processes on a DataMiner Agent, with multiple DataMiner elements running in the same protocol process. To find out which element is running in which process, you can check the Element In Protocol log.
This can lead to an impact on multiple DataMiner elements in case the process or the thread encounters a problem. This is indicated in the Alarm Console with a message that ends with "+ x Pending", where x is the number of extra affected DataMiner elements.
For more information on protocol threads and the SLProtocol process, see SLProtocol.
Protocol runtime errors
When a protocol thread takes too long to finish or gets stuck processing a group (most likely not being able to recover by itself), this is indicated as a protocol runtime error (RTE). RTEs are displayed both in the DataMiner Alarm Console and in the DataMiner Watchdog logging.
For more information on RTEs in the Watchdog logging, see Watchdog logging.
The Alarm Console displays an error when the last state of an RTE (open) is reached for an element. It displays general information on the RTE, including the element that caused it. When the RTE is resolved, the error message in the Alarm Console will disappear.
To see the RTEs in the Alarm Console, in DataMiner Cube, click the alarm bar at the bottom, select the “Active Alarms” tab and search for the RTE Alarm. For more information on how to work with the Alarm Console, see Working with the Alarm Console.
SLNetClientTest tool
In order to gather more information on an RTE (e.g., to find out which group caused the issue or how long it took), you can use the SLNetClientTest tool. For information on this tool, see SLNetClientTest tool. Note that you should always be very careful when you use this tool, as it allows actions that can have far-reaching consequences for a DataMiner System.
For more information on how to use this tool to retrieve protocol pending calls, see How to retrieve protocol pending calls?
Protocol thread RTE states
An RTE can have three states: half-open, open and cleared.
Half-open
By default, when a group takes longer than 7 minutes and 30 seconds and less than 15 minutes to finish, it is considered to be in a half-open state. When this happens, a message is sent to the Watchdog logging specifying the thread that is affected and the element causing the issue. For example:
<Timestamp> 21488|HALFOPEN RTE: - (1769) Not signaled 1 (since <Last Timestamp>): SLProtocol.exe - [RTE Example/1.0.0.1] RTE Example - ProtocolThread [pid 22844 - thread 29876] [element 710/74] in Process: SLProtocol.exe for Thread: [RTE Example/1.0.0.1] RTE Example - ProtocolThread notificationID created: 6481
Open
When the group takes longer than 15 minutes to finish, it enters an open RTE state. It sends a message to the Watchdog log specifying the affected thread and element and also displays an alarm in the Alarm Console with a summary of the information it sent to the Watchdog log. For example, the screenshot below shows a protocol thread open RTE in the Alarm Console, caused by the element “RTEExample” taking too long (15 minutes). The delay was caused by a QAction triggered by a button that also had an RTE (SetParameterThread RTE).

For this example, this is what the RTE looks like in the SLWatchdog2 log file:
<TimeStamp>   21488|>>>>>>> (1769) THREAD PROBLEM : SLProtocol.exe - [RTE Example/1.0.0.1] RTE Example - ProtocolThread [pid 22844 - thread 29876] [element 710/74]
<TimeStamp>   21488|Send alarm for process SLProtocol.exe (bSignaled = FALSE, bStopped = FALSE) for iCookie = 1769 (RTE Count = 2)
<TimeStamp>   21488|OPEN RTE: Runtime error count 2 in process SLProtocol.exe on agent MIGUELGA in Process: SLProtocol.exe for Thread: [RTE Example/1.0.0.1] RTE Example - ProtocolThread with notificationID: 6481
Cleared
If a group finishes its work while it was in the half-open or open RTE state, it will enter the cleared state. When it enters this state, a message is sent to the Watchdog log specifying the transition and thread information. In case it was in open RTE state, the RTE alarm in the Alarm Console is cleared.
For example, the following message indicates a half-open RTE becoming cleared:
<TimeStamp> 10896|CLEARED RTE: HALFOPEN Runtime error cleared in SLElement.exe - Database thread [pid 14524 - thread 20316] on agent MIGUELGA in Process: SLElement.exe for Thread: Database thread with NotificationID: 5013
The following message indicates an open RTE becoming cleared:
<TimeStamp>   21488|Send alarm for process SLProtocol.exe (bSignaled = TRUE, bStopped = FALSE) for iCookie = 1769 (RTE Count = 0)
<TimeStamp>   21488|CLEARED RTE: Runtime error cleared in process SLProtocol.exe on agent MIGUELGA in Process: SLProtocol.exe for Thread: [RTE Example/1.0.0.1] RTE Example - ProtocolThread with NotificationID: 6481
Use cases
For more information on the basic steps of how to investigate a protocol thread RTE, see Investigating a protocol thread RTE.
A group is considered finished when the content of the group is fully executed (e.g., all data has been acquired), and all linked logic is fully executed (e.g., all necessary calculations have been done based on the acquired data).
A simple solution in cases where a single group takes too long to process is to divide the group into smaller groups focusing on certain parts of the logic.
In some cases, it can occur that an RTE is not completely caused by one group only, and other factors influence it as well. Below you can find several use cases to illustrate this, with the possible solutions.
Case 1: A group’s content and QActions do not take longer than the default RTE times to process, but an RTE caused by the group still appears
This can originate from a group that is waiting for other flows to finish before executing.
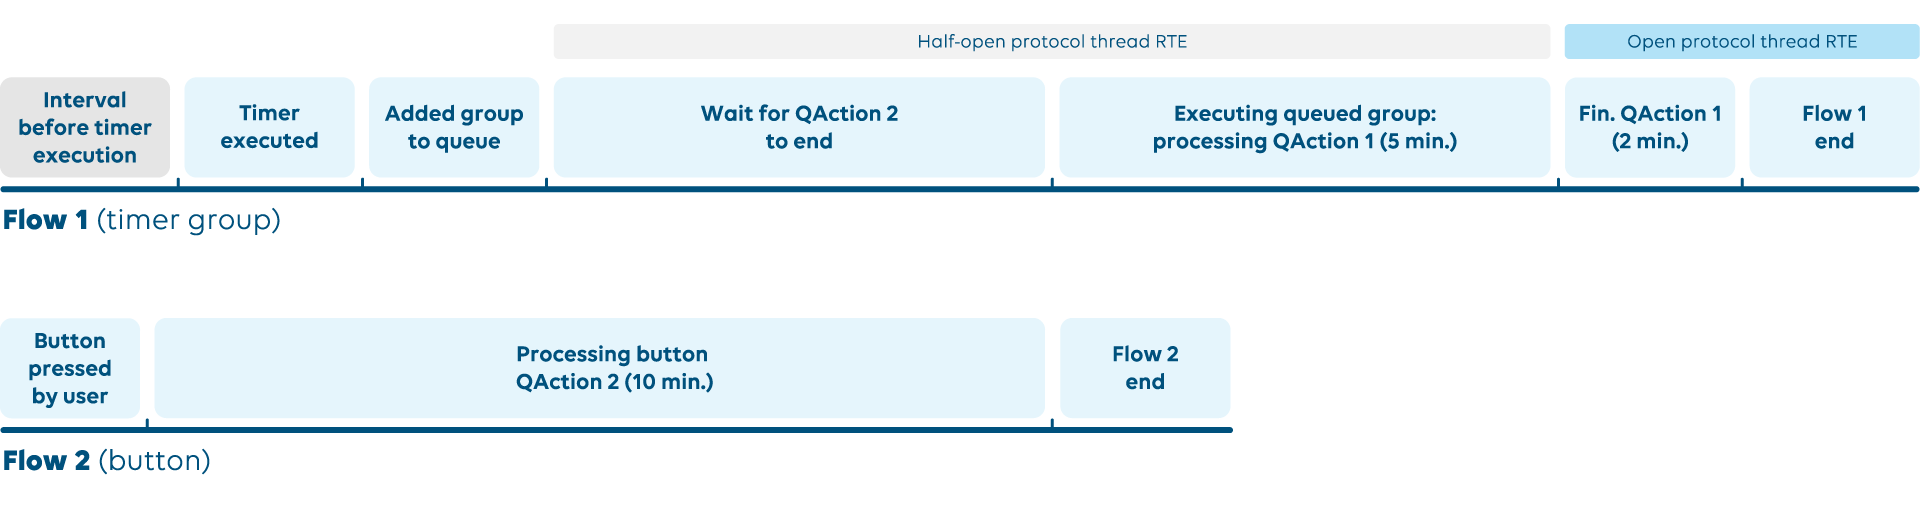
The example above depicts a situation where an open protocol thread RTE (15 min) is caused by a group in a timer in flow 1 with a QAction that takes 7 minutes to operate. This is caused by the flow 2 QAction triggered by the button pressed by the user. Only one QAction can run at one point per element. Because of this, the group in flow 1 waits for QAction 2 to finish before executing its QAction. The accumulated time of having to wait and process its own QAction would be approximately 17 minutes, causing the RTE.
Lesson
When investigating the cause of an RTE, do not eliminate QActions that alone could not cause the RTE. Another factor could be affecting the thread that is used by the QAction.
Solution
Make sure that the time between starting and ending the item on the thread (group, protocol thread, set on a SetParam thread) is not too long.
Minimize the number of calls to other processes (protocol calls, DataMiner calls, etc.).
Notes
Case 1 can be a direct result of case 2.
In situations where an RTE happens because of other QActions triggered by a button, it is also possible to find a SetParam RTE if the other QAction took more than the default open RTE time (15 min).
Multiple sets on the same element are handled sequentially. There can be more than one set influencing the timer group flow.
The sets can be caused by other external sources than the client, like an automation script, Visual Overview, data distribution, traps, element connections, etc.
Alternative case
Below is a similar case caused not by external influence but by a parameter change trigger.
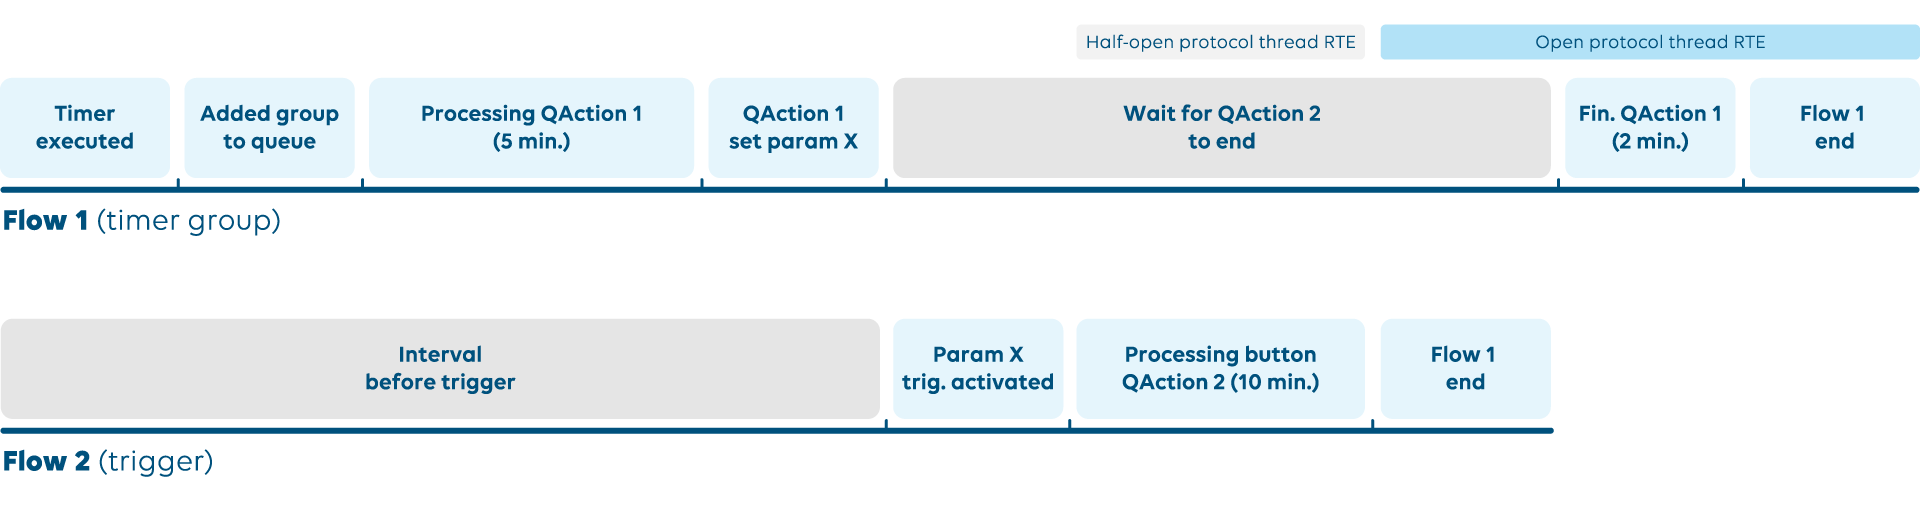
This is caused by the SetParam present in the QAction of flow 1. It changes a parameter, triggering the execution of the QAction in flow 2 and pausing the current QAction. The accumulated time of the QAction in flow 1 (7 min) and the QAction in flow 2 (10 min) causes the open RTE.
Case 2: An external request is handled while a polling group has not yet finished, causing a group execution to take longer than expected
This case originates when a new flow starts while the polling flow is waiting for requested data to be received.
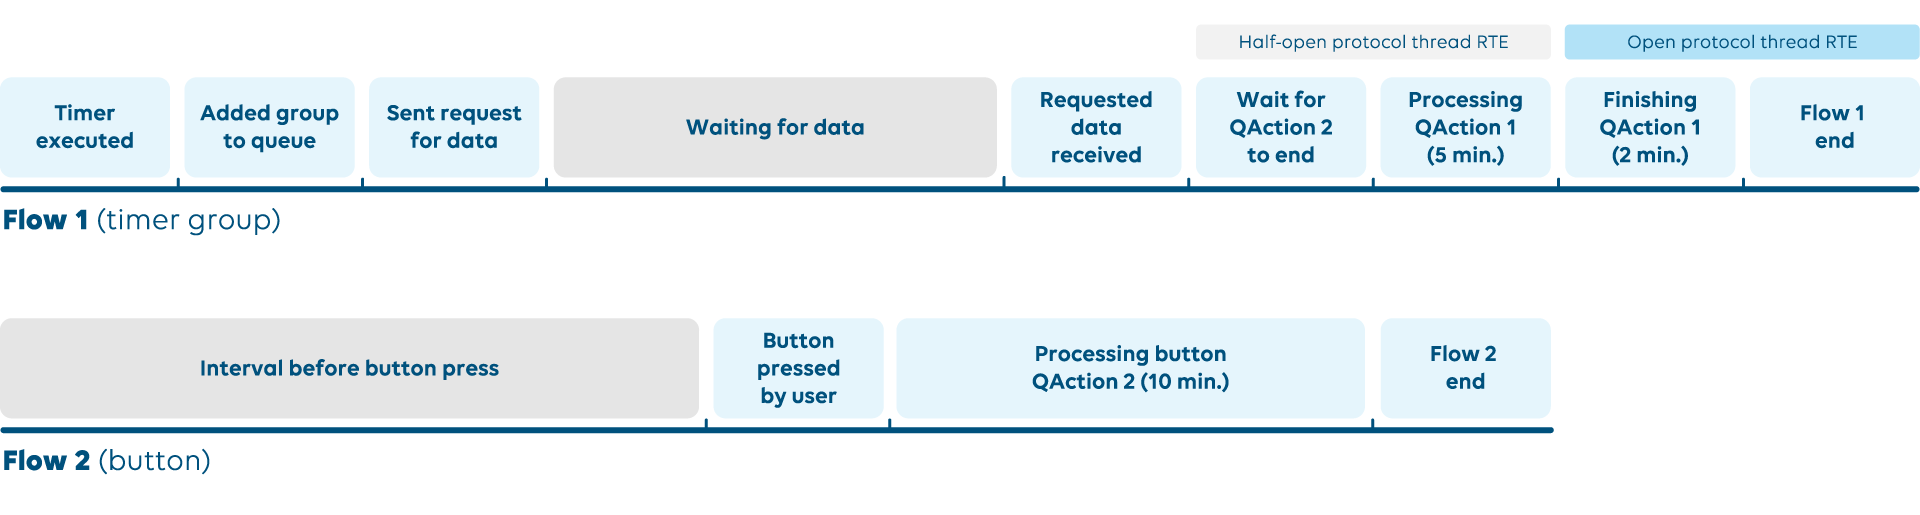
In the example above, a time group in flow 1 requests external data and processes it using a QAction in less than 7 minutes; however, it still has an open protocol thread RTE (15 min). This is caused by flow 2 in combination with the polling logic.
The polling request requires that it is sent to the corresponding process that handles the communication to the external product (SLPort or SLSNMPManager). During the time that it is waiting for the data to be received, the group is in a state where the task of sending the request is finished but the end goal, processing the data, is not yet complete. It allows the flow 2 QAction to be executed. When the requested data is received, flow 1 has to wait for QAction 2 to finish before it can execute QAction 1, causing flow 1 to take at least 17 minutes, which causes the RTE.
Lesson
Finishing one request is not the same as completing the end goal. If the flow unlocks the process, it is possible for another flow to lock the process and force the first request to wait for long enough that an RTE is triggered.
Solution
If the flow takes too long, it is best to split it up into smaller steps (e.g., polling 10 items one by one instead of all at once). This way, the access point to the process is unlocked in between each step. It is also possible to include the possibility to cancel the flow.
Note
Case 2 can cause case 1 and can be influenced by case 3.
Case 3: Polling large/slow tables
There can be a situation when polling a large or slow SNMP table is required. This polling can lead to false positive protocol thread RTEs (RTEs caused by groups that are not irreversibly stuck but take a long time to complete) that affect both the poll group and all the groups in the queue.
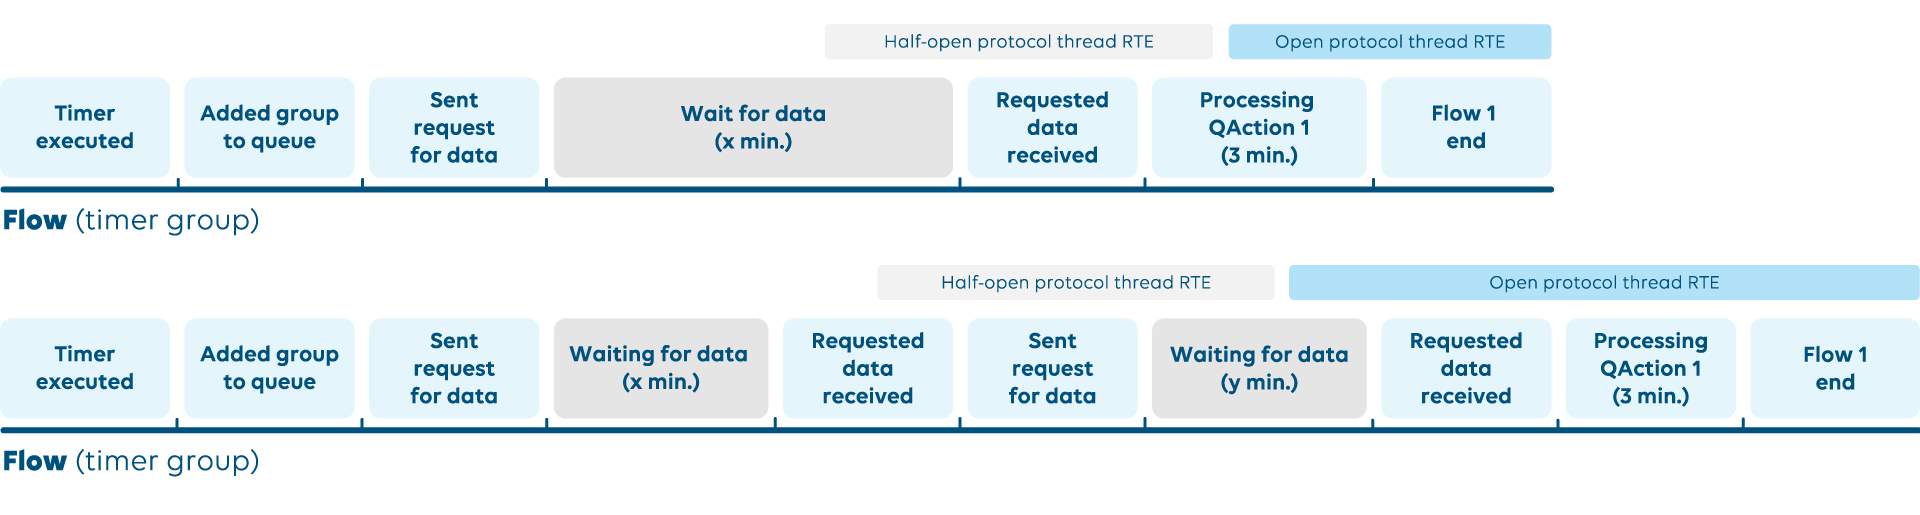
The examples above can originate from multiple cases:
SNMP single request:
The time it takes to poll a single request for a large table, together with the 3 minutes of processing in the QAction, can cause the false positive RTE.
Slow internet can cause a long wait for the data even for a small table, depending on the connection.
SNMP multiple requests:
- If there are multiple requests where a single group requests multiple data, the accumulated time of the requests can cause the false positive RTE. This case can be influenced by all the cases mentioned for a single request.
Lesson
Make sure that the SNMP table you are obtaining is not too large, in size or in number, or retrieval of its data is not so slow that it causes RTEs
Solution
Use the partialSNMP feature if the polling content is too large or data retrieval is slow. This allows you to divide the SNMP group requests into smaller group requests, preventing false positive RTEs and also allowing for other groups to be added between the parts, and thereby increasing the responsiveness towards external sets (user interaction, faster polling).
Note
Case 3 can affect case 2.
Case 4: A flow requires the processing of a variable number of items (e.g., files from an FTP server) after a few years in use (large items or many files)
The processing logic is done in a QAction. The information received influences the processing time.
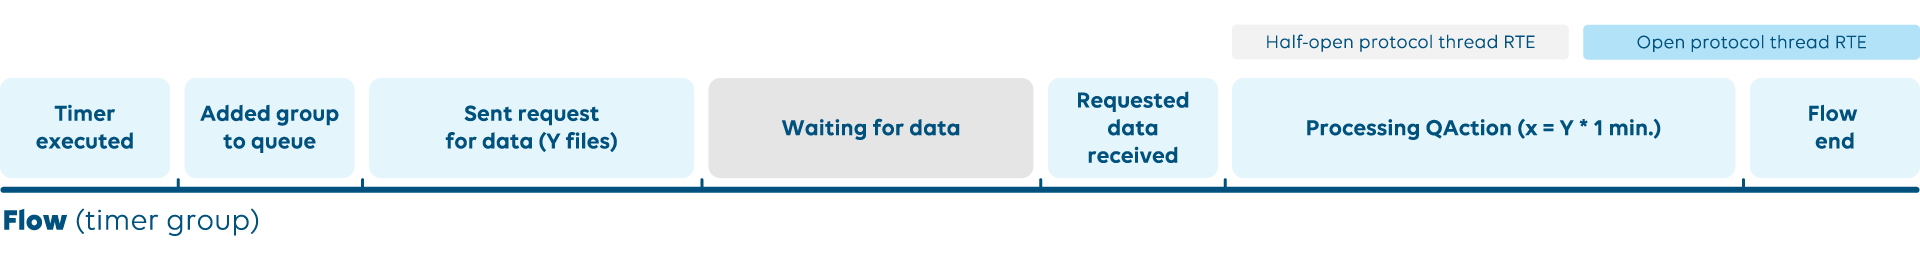
In the example above, a group is configured to request Y files to process from an FTP server. It takes 1 minute to process each received file. The Y file count is influenced by the configuration and the total number of files on the server. If a large number of files are requested (15 or more in this case), this will cause an open protocol thread RTE (15 min).
An open protocol thread RTE can also occur if the files increase in size instead of in number. In that case, the Y value in the example above remains the same, but the processing time for each file increases to more than 1 minute.
A bad configuration or the accumulation of files or file data on the server are possible causes for what happens in this example. Because of this, multiple setups on different clients can yield different results.
Lesson
External changes can also cause a protocol thread RTE. It is important to pay attention to external data and configurations.
Solution
Change the logic of the file request to divide it into smaller chunks.
Alternatively, you can add an option to cancel the execution.
Lastly, you can create a safety mechanism that manually clears the excess files, reducing the group request time.
Note
Case 3 and case 4 are very similar in concept.
Case 5: Ping group
When a group with ID -1 is the root of an open protocol thread RTE, then the cause is a badly defined ping group in the protocol definition (see Ping group).
A ping group needs to be a polling group
A ping group only works on the first connection
Note that the ping group is only used when slow polling is active on the element. This is the reason a connector with a badly defined ping will work perfectly when slow polling is not activated.