Investigating slow device control using dotTrace
This use case focuses on a matrix connector that performed too slowly, and this in a live environment that brought very strict limitations to the investigation.
When the matrix connector was tested in the production environment, it took approximately 2 seconds on average for a crosspoint to be set. This was much slower than anticipated, so we went looking for the root cause behind this.
The specific limitations of the live environment made it impossible to make connector changes, for example to add logging or to duplicate existing elements. This meant that this was a very difficult investigation. However, using an Automation script, Wireshark, and performance profiling, we were able to get a decent picture of the performance of the system and the connector.
Automation script
We created a simple Automation script that performs a set on a live element with the approval of the system operators. This script works as follows:
Save the timestamp just before the SetParameter action.
Make the crosspoint on the write parameter.
Enter a retry loop to check if the read parameter has been updated every 20 ms.
If the correct value from set 2 has been retrieved, save a timestamp.
Print the timestamps.
This gives an overview of the beginning and the end of the action. In our case, we noticed that 2 seconds were lost in the overall process. We wanted to investigate this further to see why.
Wireshark
Wireshark visualizes the communication between DataMiner and the device.
Using the timestamps from the Automation script and the timestamps from Wireshark, we were able to see that 60 ms were lost between setting the crosspoint on the write parameter of the element and the transmission of the message to the device to execute this. The device took 200 ms to respond. The remaining time (approx. 1.7 seconds) was used in DataMiner to process the response message.
With this knowledge, the usual approach would have been to start adding timestamps in a debug version of the connector to see which QAction/method takes the most time. However, this was not possible in the live environment.
Performance profiling
To further investigate the performance of the QActions, we had to turn to performance profiling. This can be achieved by taking a snapshot of the SLScripting process, since this is the process the QActions are running in. The snapshots have to be taken while the QAction responsible for handling the device response is running.
To take these snapshots, we used dotTrace.
Setup
To start taking snapshots of the process, check on which server the element is hosted, and then place the dotTrace Command-Line Profiler on this server and unzip it.
Open a command prompt as Administrator and navigate to the location where you placed the command line profiler, e.g.:
cd C:\Skyline_Data\JetBrains.dotTrace.CommandLineTools.windows-x64.2022.2.3Look up the SLScripting process ID in the Windows Task Manager:

With this, you are now ready to start entering commands to take snapshots.
Commands
There are four different ways to take a snapshot of a process: three Performance Profiling types and a Timeline Profiling type.
While in this use case timeline profiling seemed to be the best profiling type, because it would show in which order the calls were made, the server did not allow this. This manifested as an error when the profiling command was started. The normal solution for this would be to reboot the server, but this is not an option in a production environment.
The other profiling types could affect performance, except for sampling profiling. Fortunately, the server accepted this profiling type, so we could use this command:
dottrace attach 37392 --profiling-type=Sampling --timeout=60s
This command attaches to the process with ID 37392 with the sampling profiling type. The snapshot will be taken over a duration of 60 seconds.
By default, the snapshot files will be saved under the command-line tool file structure.
Note
Do not rename the snapshot files; otherwise it will not be possible to open them.
Tip
For more information about the commands, refer to the command-line tool manual.
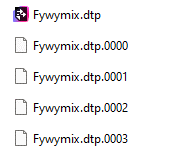
The resulting snapshot files will look like this:

Investigating the snapshot files
Move the files to a location where dotTrace is installed and activated.
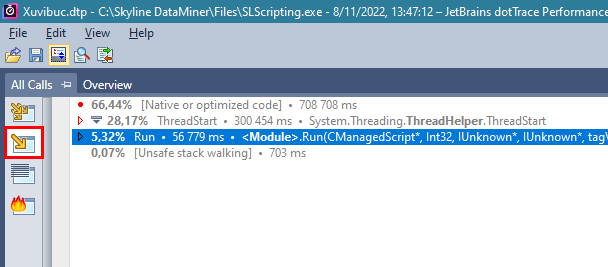
Open the main file.
Click the Call Tree button on the left.

By default, the Threads Tree is displayed, which shows all the threads that were created during the sampling. However, for this use case, the Call Tree is a lot more useful. It shows a representation of all function calls in all threads.
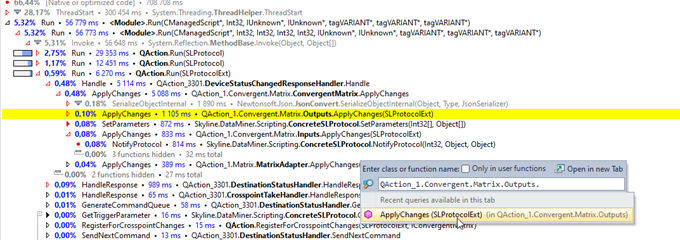
Use "Ctrl+F" to search for method names in the snapshot that can give you an indication of how long a method or call took to complete.
In this case, we looked for the ApplyChanges of the Outputs.

This shows that the serialization and the Output.ApplyChanges takes the largest amount of time. Now that we know where most time is spent, we can focus our efforts on these sections of the connector code.
An important limitation of sampling is that it is not possible to see how many times a method was executed or when. However, you can see in a blink of an eye where most time is spent in the execution of the QActions. This is the biggest advantage of using this tool. It shows you exactly which part of the connector you should focus on.