Working with the Asset Management application
The sidebar on the left of the Asset Management application contains buttons that can be used to access different pages of the app:
| Button | Page description |
|---|---|
| Opens the Asset overview page, which displays an overview of all your assets. You can use the query filter to quickly locate specific items. This page serves as the initial landing page upon accessing the application. | |
| Opens the QR code page, which provides an overview of all URLs. On this page, you can create all QR codes simultaneously, which you can then attach to the corresponding devices. | |
| Opens the Complete assets overview page, which displays an overview of assets, with a bulk update option available via a pre-designed Excel sheet. | |
| Opens the Alarm history page, which provides an overview of all asset alarms monitored in your DataMiner System. |
Important
The asset detail report pages are not accessible via the sidebar.
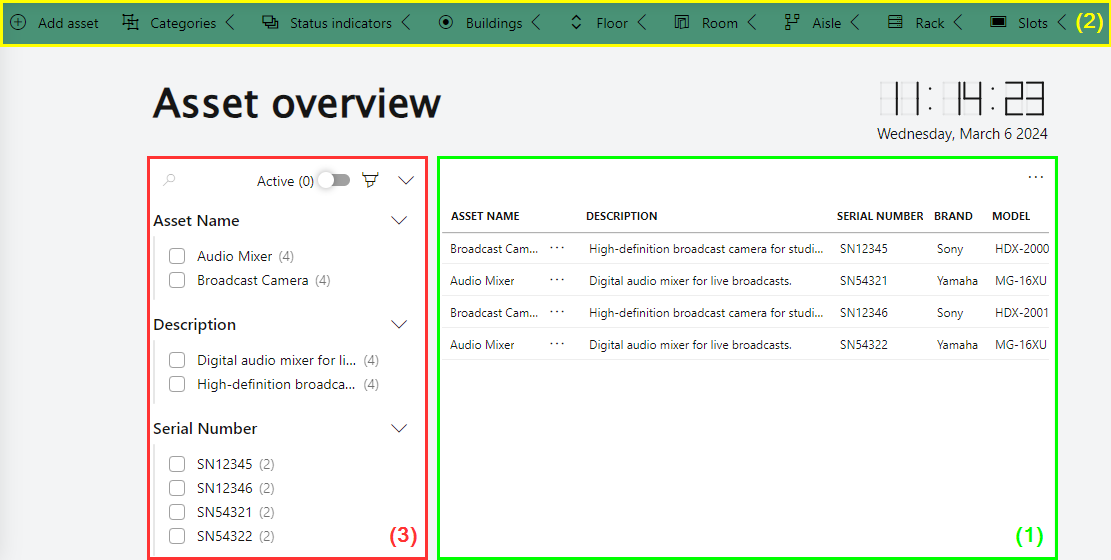
The 'Asset overview' page
The Asset overview page consists of the following main components:
Header bar (2)
Filter pane (3)
DataMiner Low-Code Apps in DataMiner 10.4.3
Overview of all assets
When you access the Asset Management application, you are presented with a table component displaying an overview of all your assets on the Asset overview page. This table offers comprehensive insight into your assets and features a query filter component that helps you locate specific items based on their properties.
Assets are defined based on various parameters such as categories, status indicators, buildings, floors, rooms, aisles, racks, and slots. These can be added through the header bar, which also provides access to dedicated overview panels for further management.
Within the table, clicking the ellipsis button ("...") in the second column opens a context menu that allows you to edit or delete any of the existing assets, as well as access an asset's detail report page.
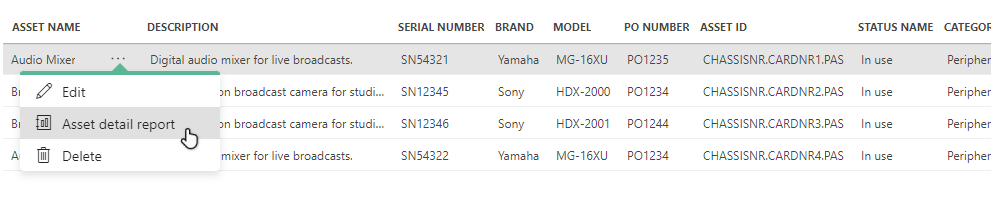
Table component in DataMiner 10.4.3
Important
To gain access to an asset's detail report page, you first need to modify the asset URLs to use your personal system.
The header bar
The header bar is only available in the Asset overview tab. In this header bar, you can find the following functionalities:
| Icon | Name | Description |
|---|---|---|
 |
Add asset | Allows you to create an asset, specifying general asset, DataMiner, accounting, SLA, and location information. Because the asset object relies on other DOM definitions, certain information can be selected directly from a dropdown list, e.g. category, status, building, floor, and more. |
 |
Categories | Allows you to add new categories by specifying a category name and ID, or review the existing list of categories in a panel to the right. To delete or modify any of the categories, click the ellipsis button ("...") next to the category and select Delete or Edit. |
 |
Status indicators | Allows you to add new status indicators, or review the existing list of status indicators. To delete or modify any of the status indicators, click the ellipsis button ("...") next to the status indicator and select Delete or Edit. |
 |
Buildings | Allows you to add new buildings, or review the existing list of buildings. To delete or modify any of the buildings, click the ellipsis button ("...") next to the building and select Delete or Edit. |
 |
Floor | Allows you to add new floors, or review the existing list of floors. To delete or modify any of the floors, click the ellipsis button ("...") next to the floor and select Delete or Edit. |
 |
Room | Allows you to add new rooms, or review the existing list of rooms. To delete or modify any of the rooms, click the ellipsis button ("...") next to the room and select Delete or Edit. |
 |
Aisle | Allows you to add new aisles, or review the existing list of aisles. To delete or modify any of the aisles, click the ellipsis button ("...") next to the aisle and select Delete or Edit. |
 |
Rack | Allows you to add new racks, or review the existing list of racks. To delete or modify any of the racks, click the ellipsis button ("...") next to the rack and select Delete or Edit. |
 |
Slots | Allows you to add new slots, or review the existing list of slots. To delete or modify any of the slots, click the ellipsis button ("...") next to the slot and select Delete or Edit. |
Note
- You cannot delete any categories, status indicators, buildings, floors, rooms, aisles, racks, and slots that are referred to in any of the assets. Attempting to delete such objects will prompt a list of the associated assets.
- Adhere to the following format when implementing the asset number:
CHASSISNUMBER.CARDNUMBER. This ensures that on asset detail report pages, the Linked cards if applicable table can display the parent-child relationship between a chassis and its associated cards, if applicable. If you do not use this format, the table will not be populated with data.
The filter pane
On the Asset overview page, a filter pane on the left enables you to narrow down assets based on their properties.
In edit mode, you can enable the filter assistance setting:
Select the query filter component, and navigate to the Settings tab in the configuration pane to the right.
Enable the Filter assistance setting in the General section of the tab.
When this setting is enabled, the column filters will assist you by providing filter suggestions and additional information such as units, step size, and more.
Caution
Depending on the size of your data, this can have an impact on performance.
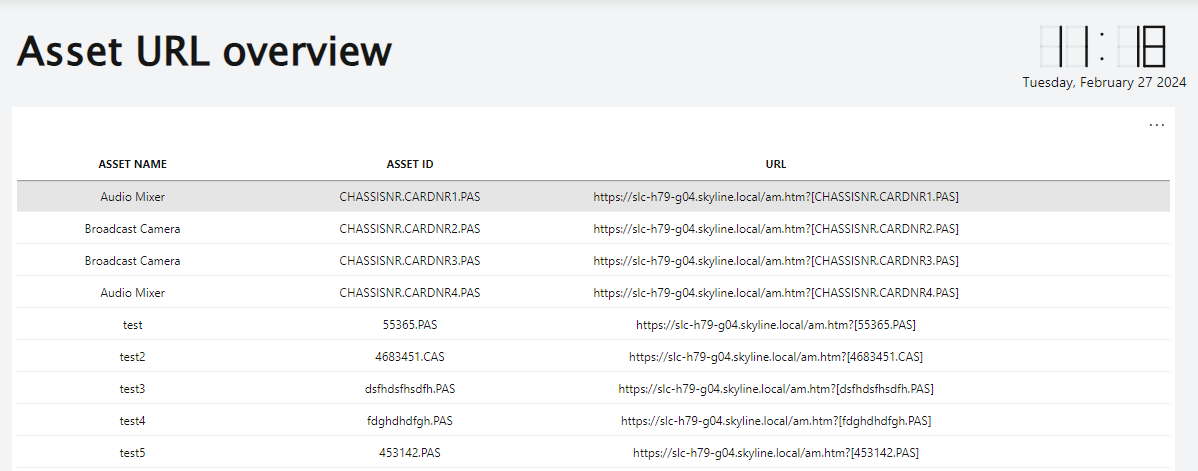
The 'QR code' page
The QR code page provides an overview of active asset URLs, which can be used to access the asset detail report pages.
Important
To gain access to an asset's detail report page, you first need to modify the asset URLs to use your personal system.
DataMiner Low-Code Apps in DataMiner 10.3.12
These URLs can be used to generate QR codes that will redirect you to the asset's detail report page when you scan them, gaining access to detailed information.
To do so:
Click the ellipsis button ("...") in the top-right corner of the table component, and select Export to CSV.
A CSV file containing the different asset URLs is now saved to your machine.
Open a QR code generator of your choice, preferably one that lets you generate QR codes in bulk, e.g. Bulk QR Code Generator.
Enter the QR data manually, or input the CSV file.
Example:
https://slc-h79-g04.skyline.local/app/95c1f6e2-c049-485d-9025-2577ddc95290/Asset%20detail%20report%20page/?data={"version":1,"components":[{"cid":14,"select":{"strings":["CHASSISNR.CARDNR1.PAS"]}}]},Audio Mixer
https://slc-h79-g04.skyline.local/app/95c1f6e2-c049-485d-9025-2577ddc95290/Asset%20detail%20report%20page/?data={"version":1,"components":[{"cid":14,"select":{"strings":["CHASSISNR.CARDNR2.PAS"]}}]},Broadcast Camera
https://slc-h79-g04.skyline.local/app/95c1f6e2-c049-485d-9025-2577ddc95290/Asset%20detail%20report%20page/?data={"version":1,"components":[{"cid":14,"select":{"strings":["CHASSISNR.CARDNR3.PAS"]}}]},Broadcast Camera
https://slc-h79-g04.skyline.local/app/95c1f6e2-c049-485d-9025-2577ddc95290/Asset%20detail%20report%20page/?data={"version":1,"components":[{"cid":14,"select":{"strings":["CHASSISNR.CARDNR4.PAS"]}}]},Audio Mixer
Generate the QR codes and download them to your machine.
The 'Complete assets overview' page
The Complete assets overview page allows you to ingest data in bulk, eliminating the need to enter each asset individually.
Important
You can only use this functionality if you have Administrator rights.
Click the Import new assets from Excel button.
Note
Clicking this button may result in an error similar to this:
Automation script "Automation script" failed.
Encountered errors while executing script: Could not start script: no statements to be executed
If this is the case, follow the procedure mentioned under Configuring the import new assets button.
In the Ingest instances pop-up window, select Choose file and upload the Excel file containing the asset data.
Click Upload.
Upon successful upload, a green checkmark will appear next to the file name.
Click Import to ingest the data.
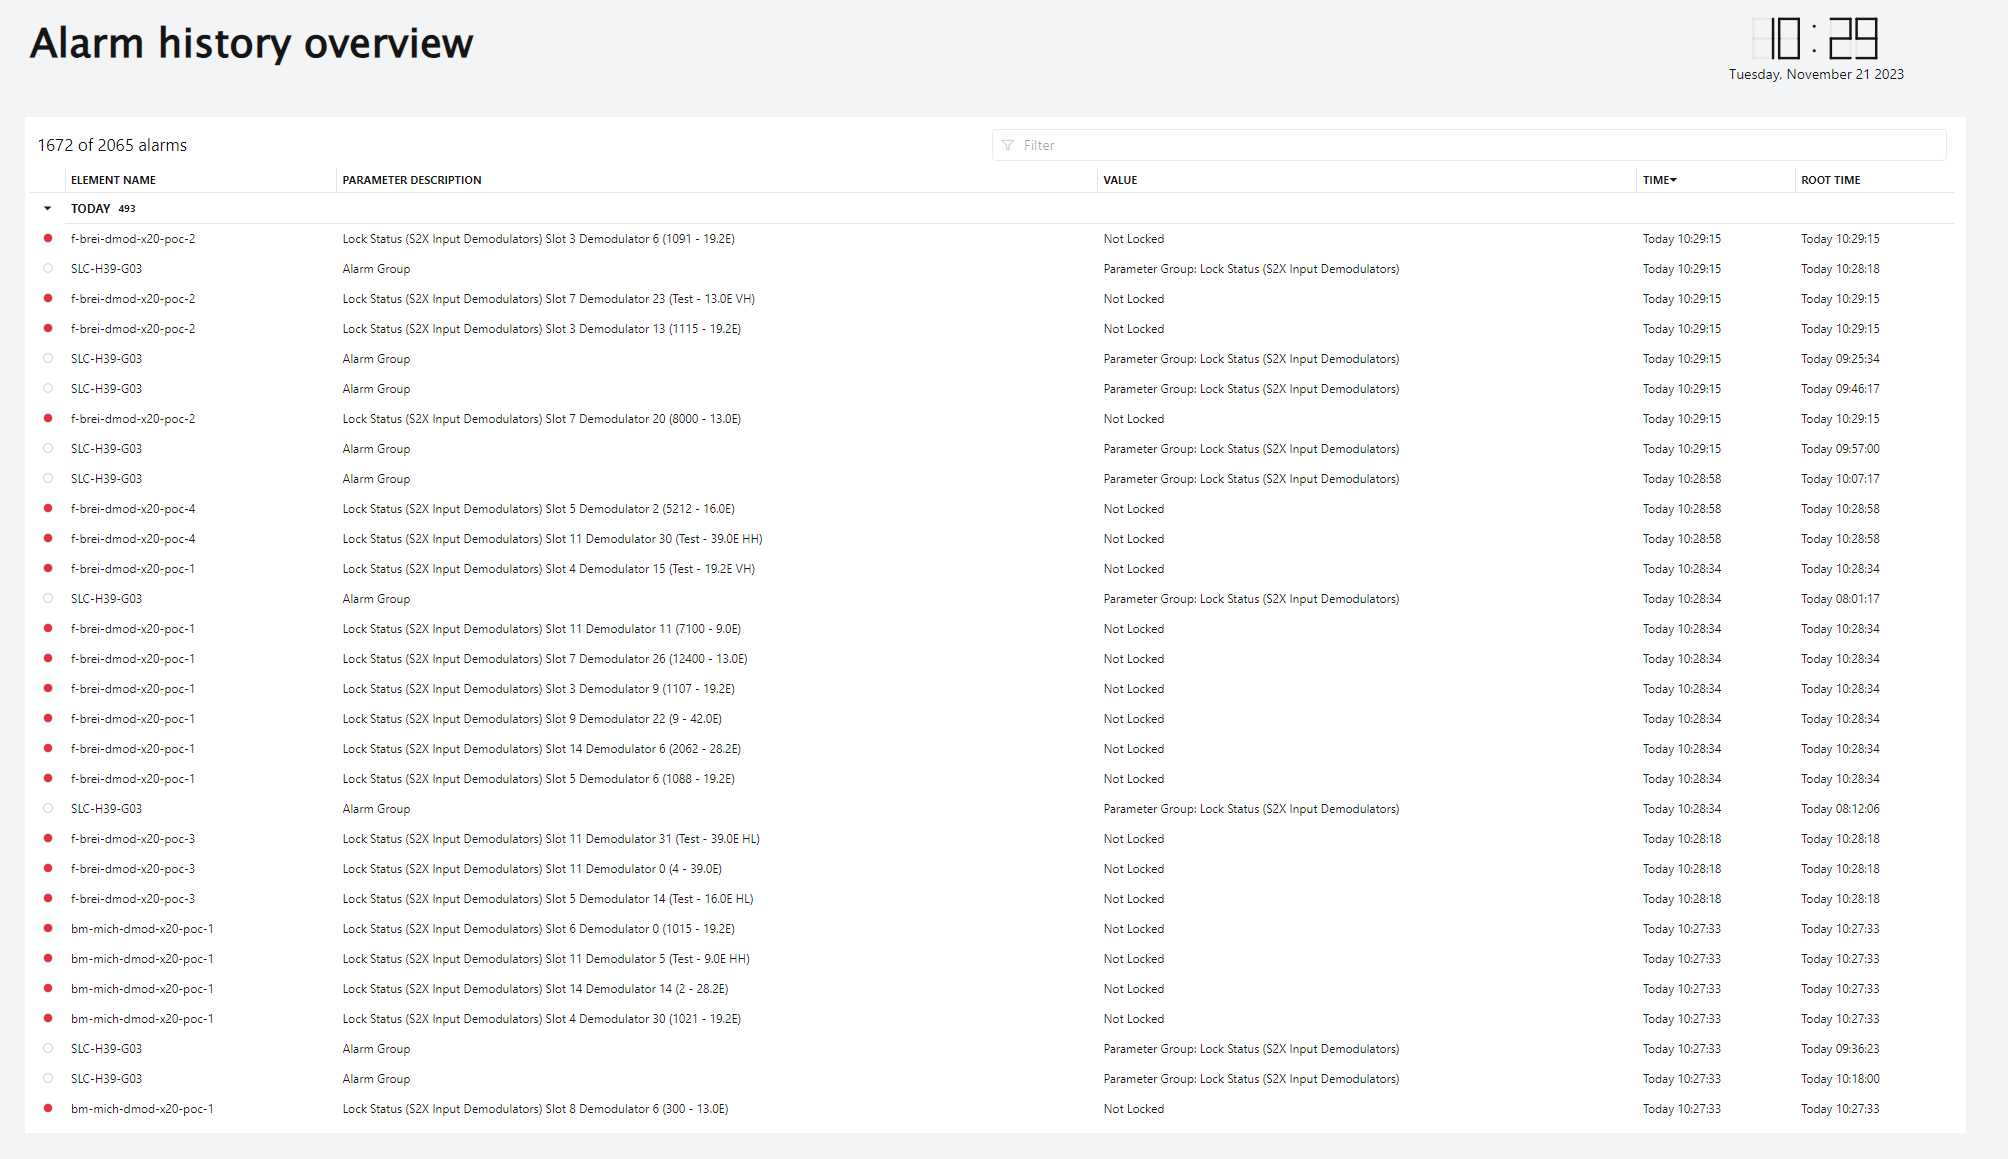
The 'Alarm history' page
The Alarm history page provides a comprehensive overview of all asset alarms monitored within your DataMiner System. You can easily filter alarms based on specific elements using the filter tool located in the top-right corner of the alarm table component.
DataMiner Low-Code Apps in DataMiner 10.3.12
Asset detail reports
You can access an asset detail report via the Asset overview table or via an asset's QR code link.
Important
To gain access to an asset's detail report page, you first need to modify the asset URLs to use your personal system.
On every asset detail report page, you can find the following information:
General information
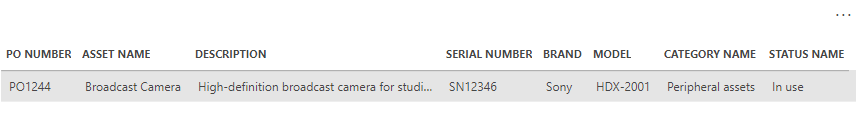
Table component in DataMiner 10.3.12Accounting information
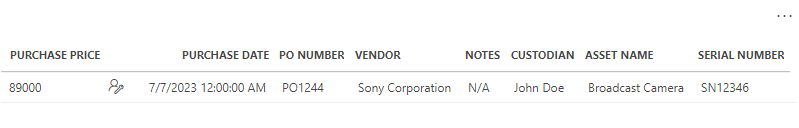
Table component in DataMiner 10.3.12Location information

Node edge graph component in DataMiner 10.3.12Linked cards if applicable
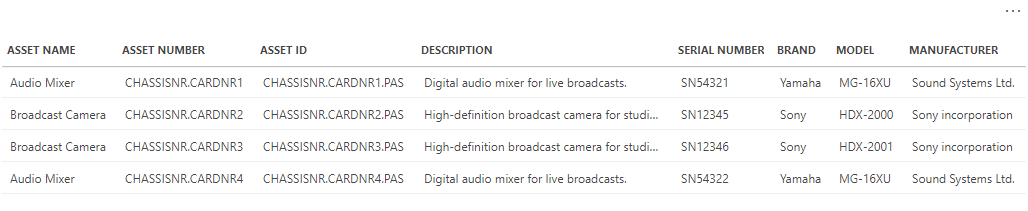
Table component in DataMiner 10.3.12Note
To ensure this table displays the parent-child relationship between a chassis and its associated cards, if applicable, adhere to the following format when implementing the asset number:
CHASSISNUMBER.CARDNUMBER.
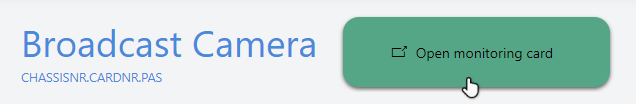
If the asset is monitored in DataMiner, you can access its monitoring card by clicking the Open monitoring card button at the top of the page.