Using the AMPP Manager app
The Grass Valley Manager application allows users to visualize and control multiple GV AMPP Manager elements.
App overview
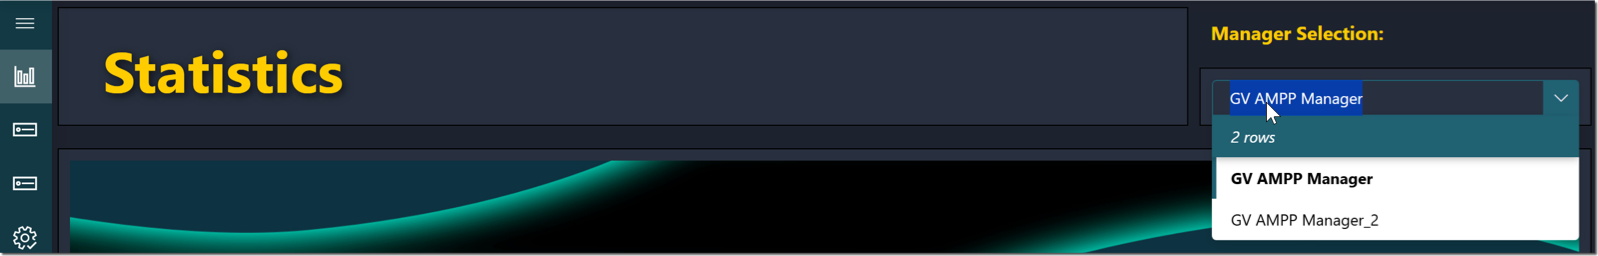
You can select a manager using the dropdown box in the upper-right corner of the Statistics page.
The sidebar on the left of the Grass Valley AMPP Manager app contains buttons that can be used to access different pages of the app:
| Button | Page description |
|---|---|
| Opens the Workloads Statistics page, which displays metrics related to workload states, application type, and their distribution across different fabrics. Additionally, the DataMiner Applications graphic shows how workloads are distributed across the different DataMiner Application elements. | |
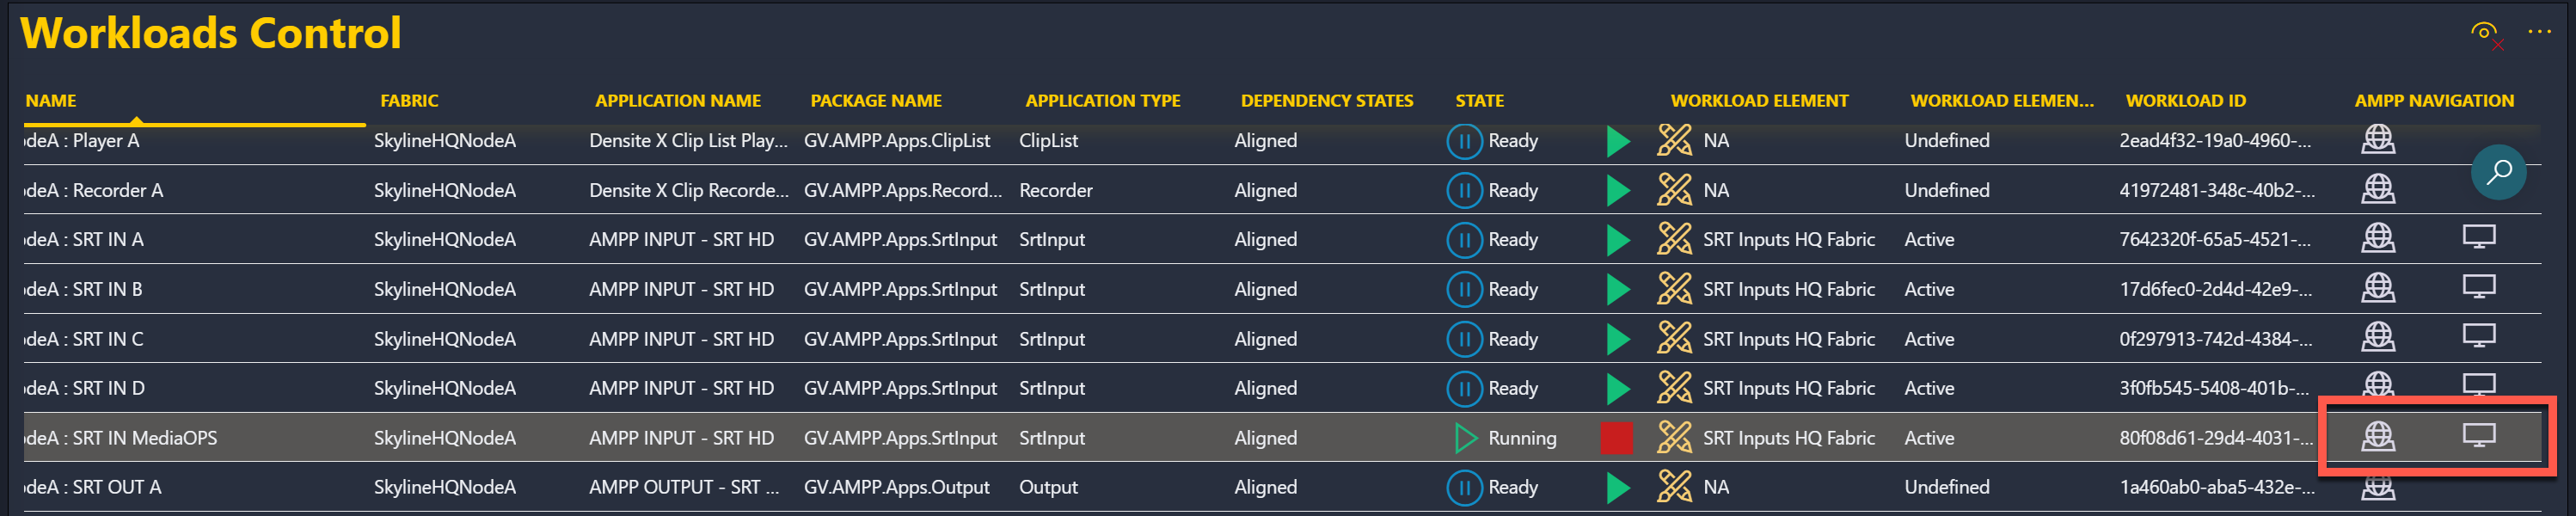
| Opens the Workloads Control page, which provides multi-criteria search and filtering, along with the ability to start or stop selected workloads. | |
| Opens the Snapshots Control page. Similar to Workloads Control, this displays a table of all discovered snapshots, allowing users to start or stop selected ones. | |
| Opens the Setup page, where users can configure the external component and create a GV AMPP Manager element. | |
| Opens the About page, which shows the application version information. |
Configuring workload application elements
On the Workloads Control page, the Workload Element column displays the currently assigned application element. An application element utilizes a specialized connector that processes the configuration and state messages specific to a particular application type. This connector also includes configuration parameters that allow changes of the workload.
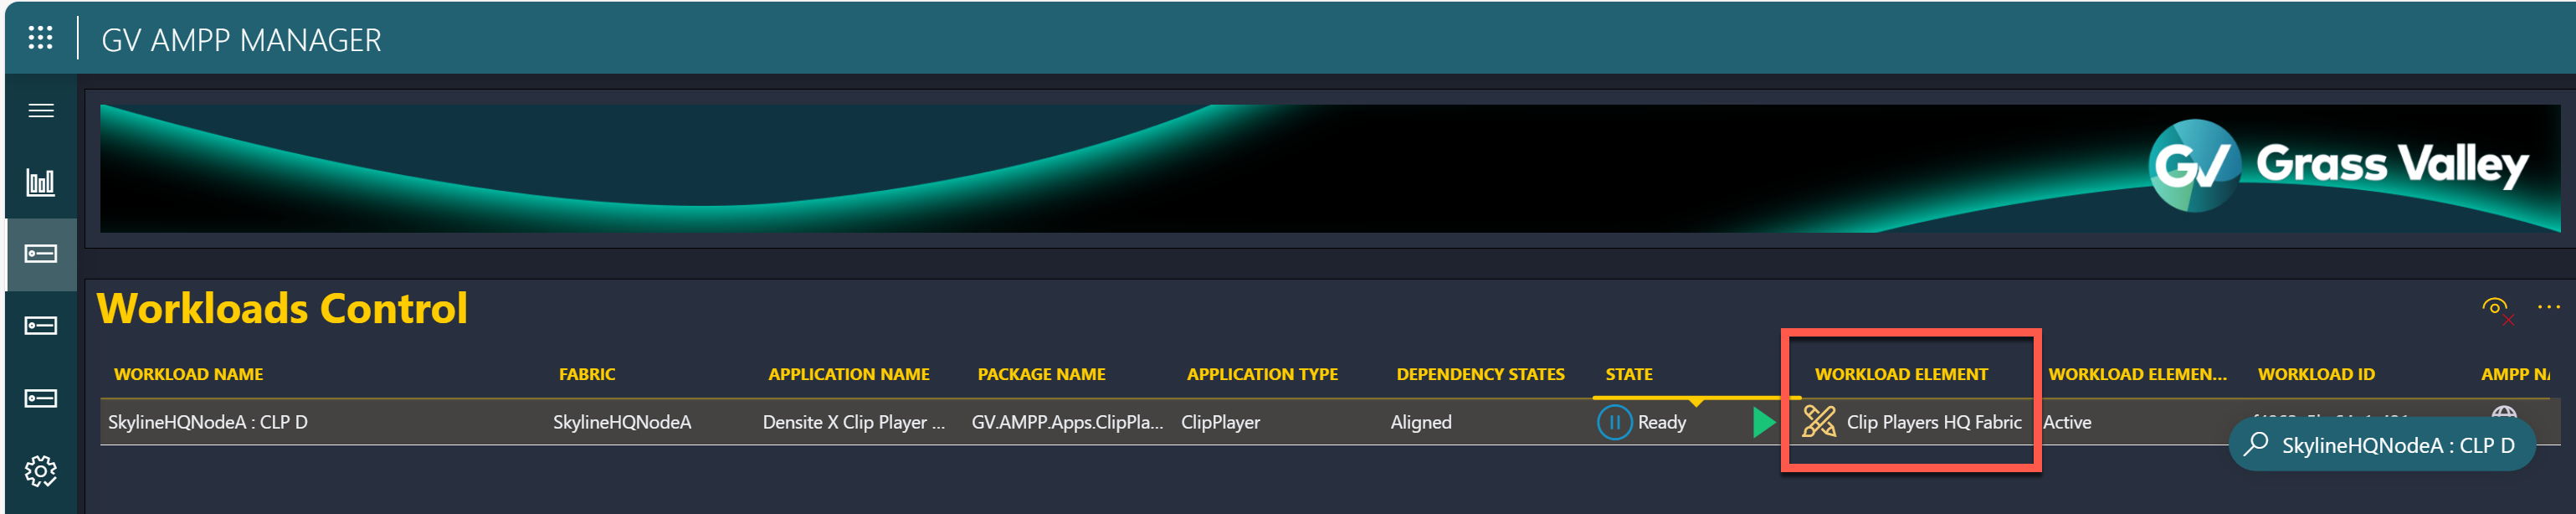
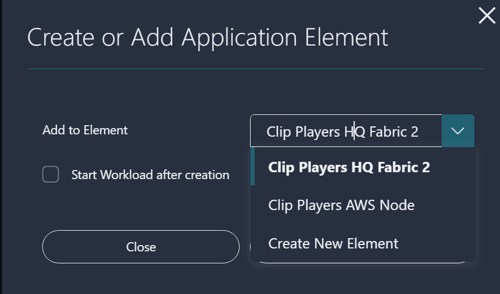
Clicking the button in the Workload Element column, as shown above, opens a dialog where you can either assign the selected workload to an existing application element or create a new element and then assign the workload to it:
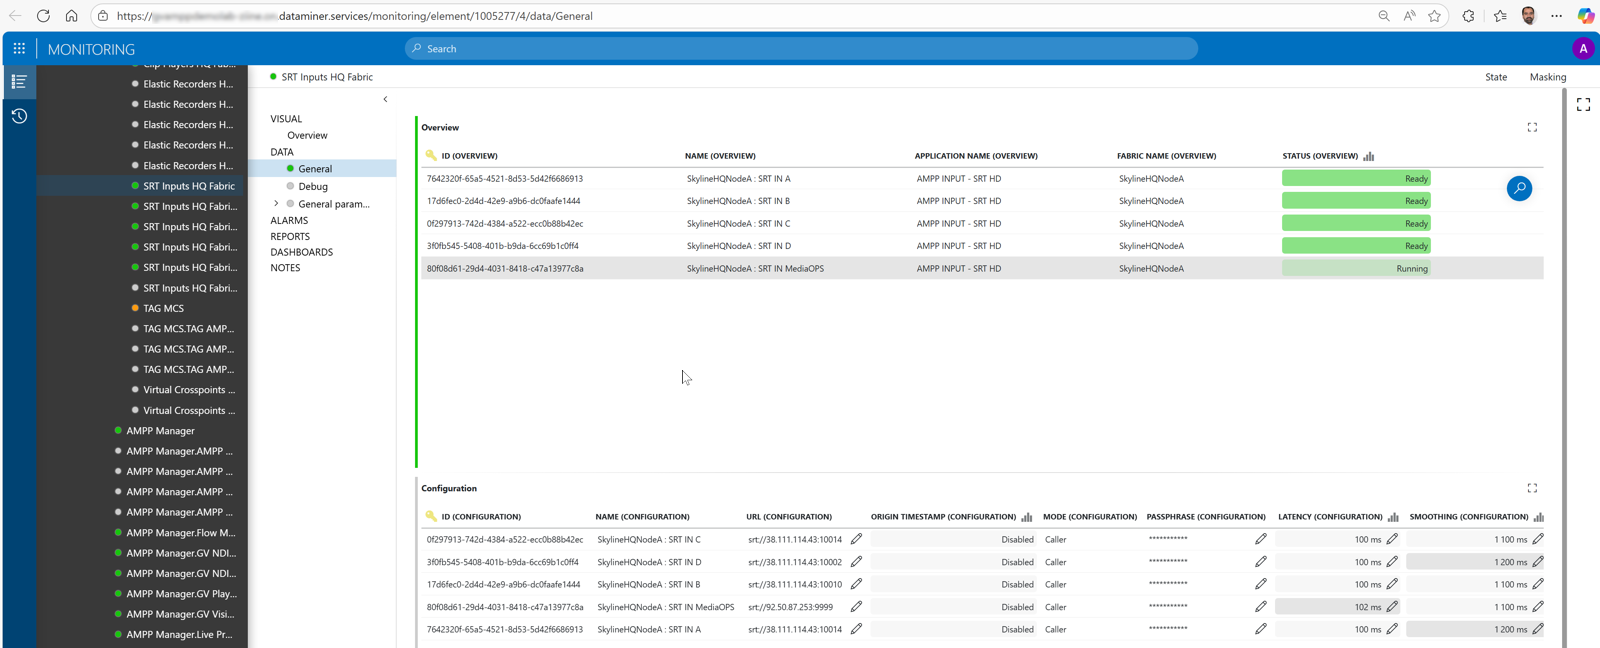
Once an application element has been assigned, you can click the icon in the AMPP Navigation column to open the application element using the Monitoring app:
In the Monitoring app, this will for example look like this: