SLAs
The SLAs page gives you a system-wide inventory of all SLAs registered in the solution, combined with live compliance data.
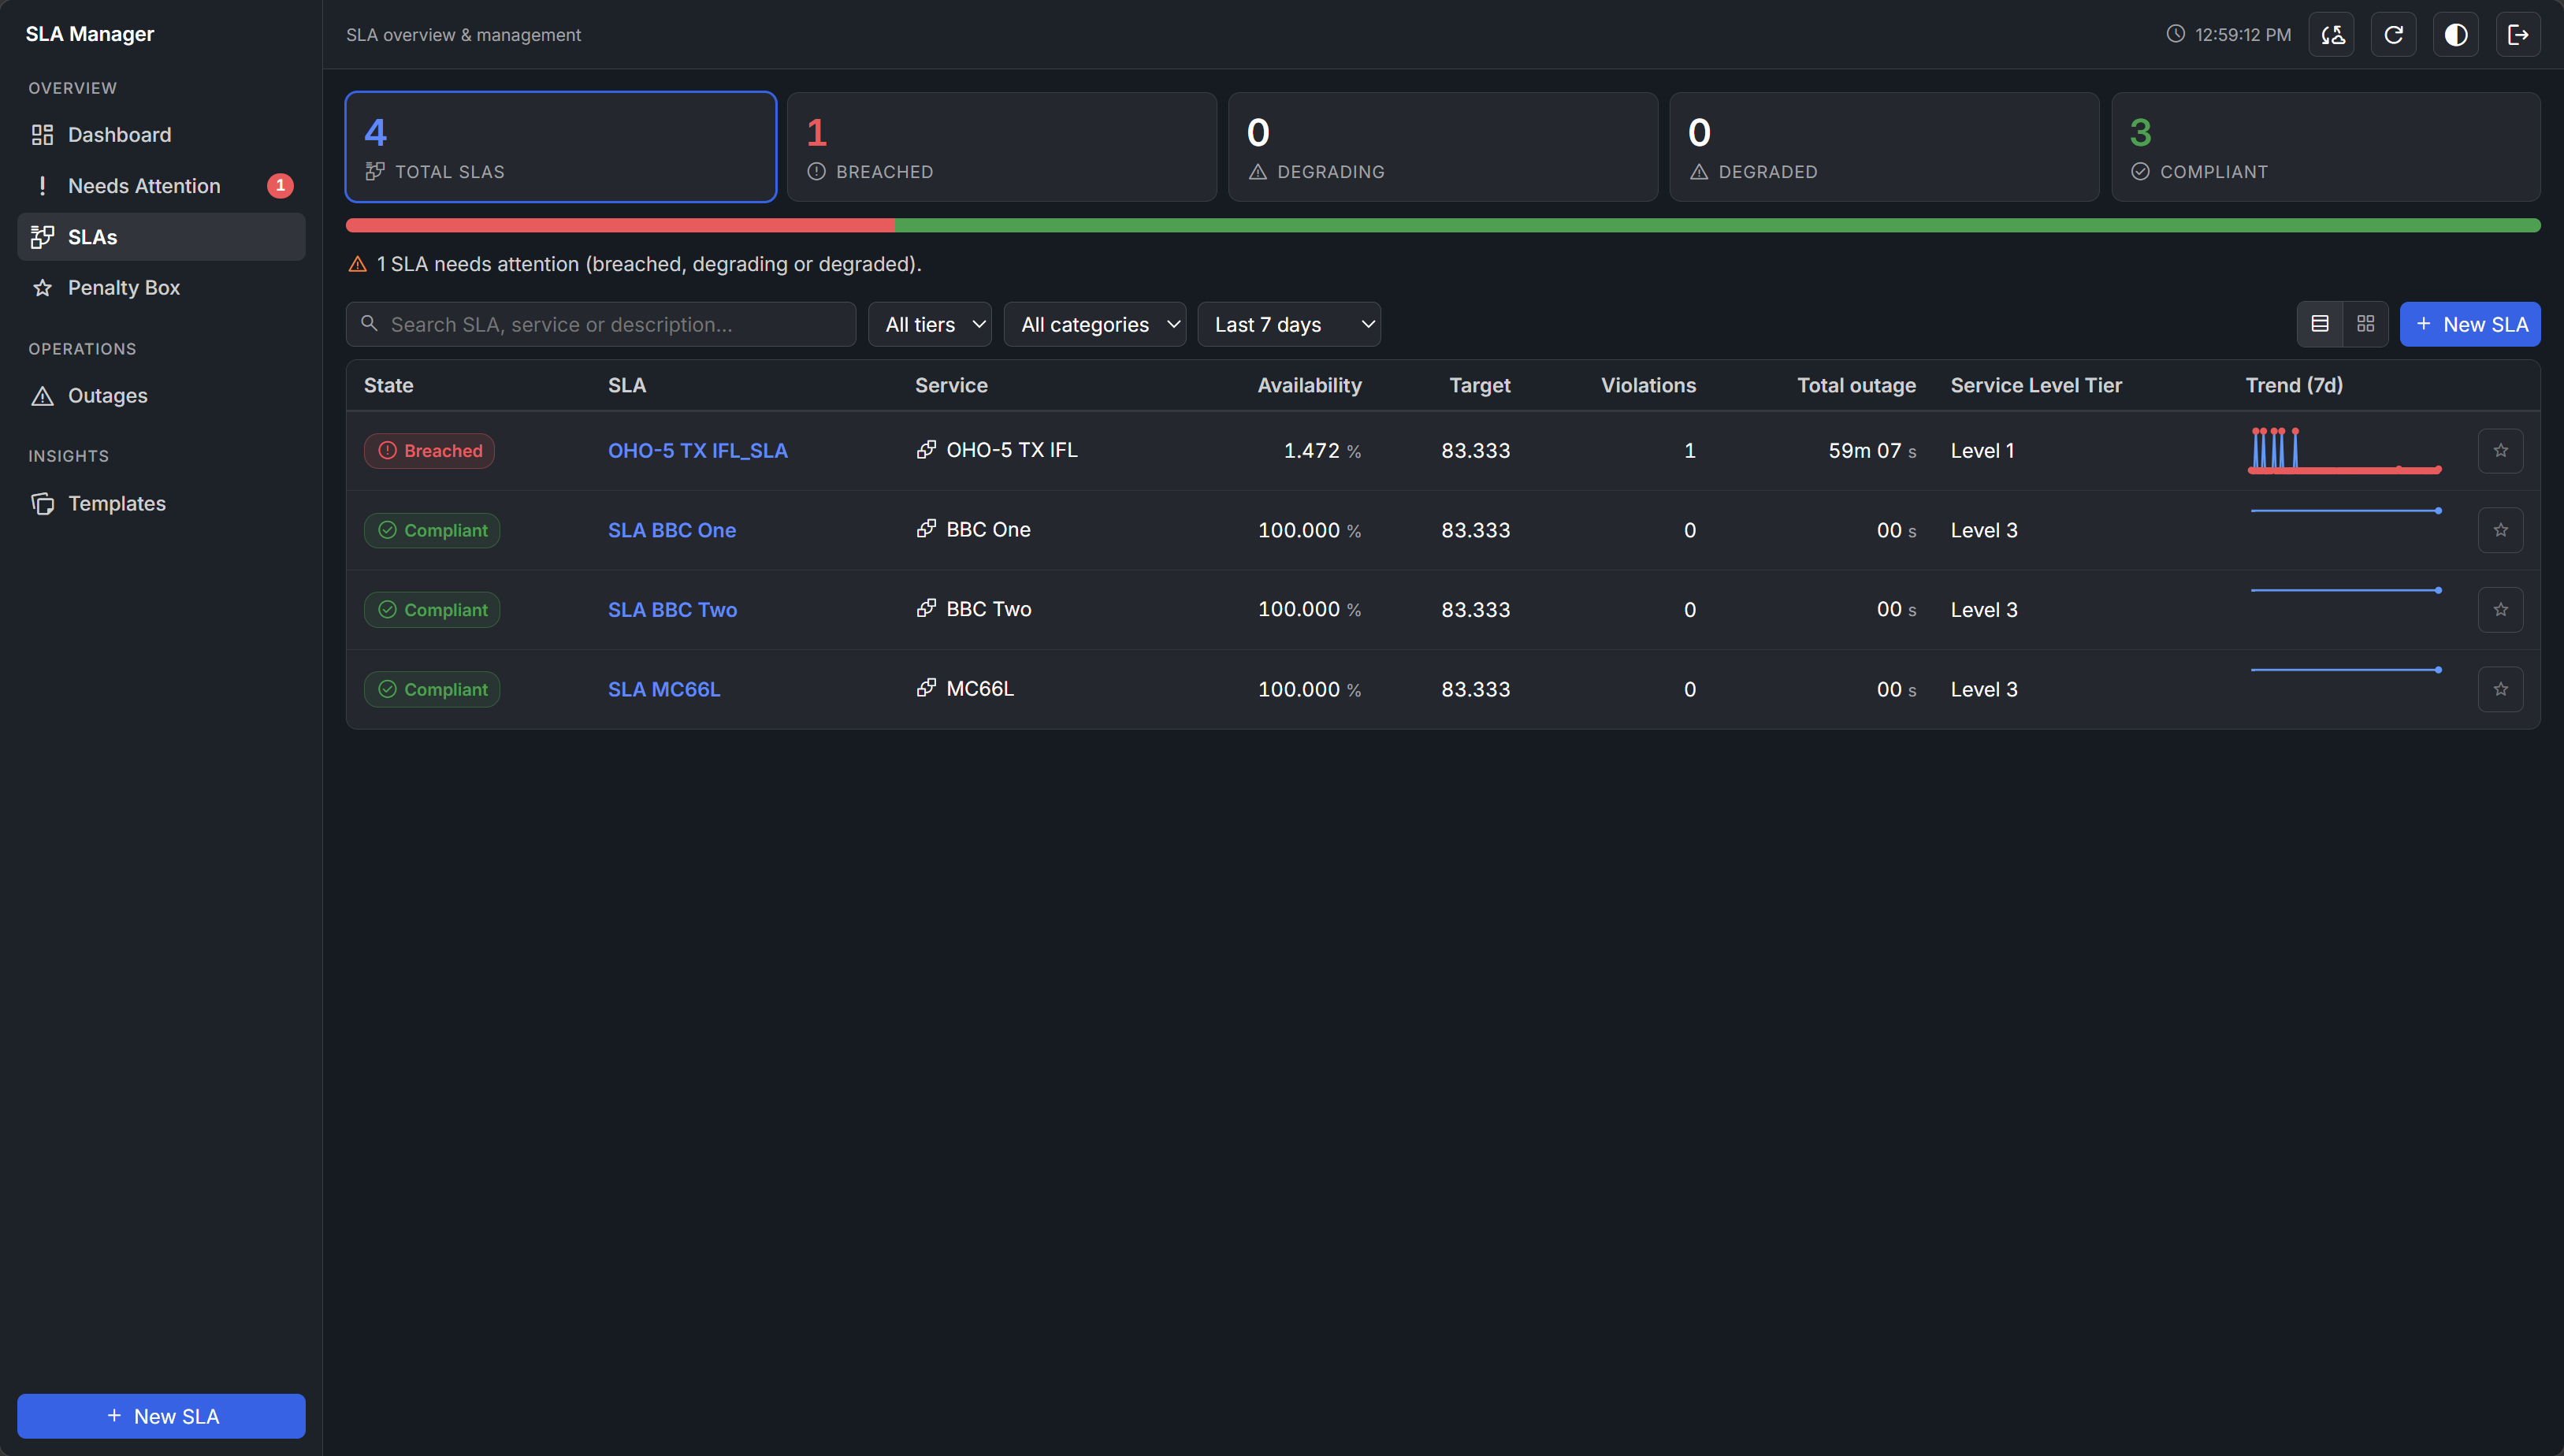
Compliance summary
At the top of the page, summary tiles show how many SLAs are currently Compliant, Degrading, Degraded, or Breached. Click a tile to filter the inventory to that state.
Table and grid views
You can switch between two views of the inventory:
- Table view: Lists every SLA, with secondary SLAs nested under their primary SLA. Each row includes an inline sparkline trend.
- Grid view: Shows primary and standalone SLAs as cards, each with a bar chart trend.
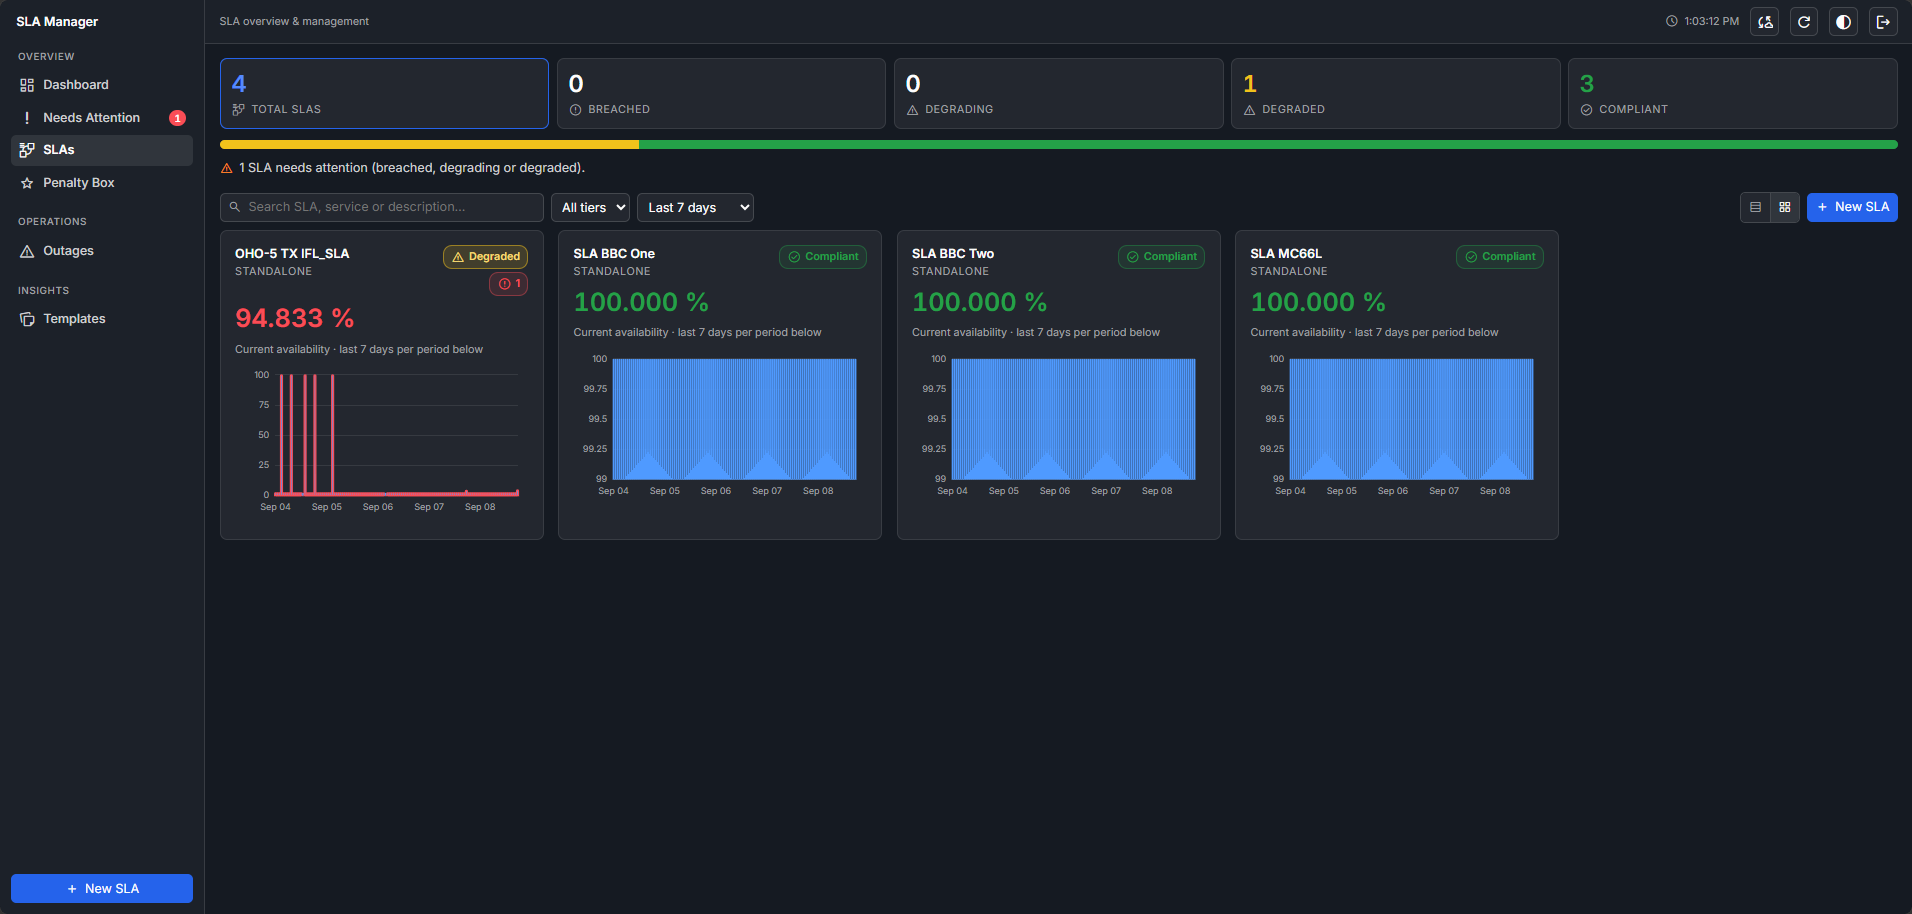
In both views, you can do the following:
- Search the inventory by name.
- Filter by service level tier and service category.
- Select the trend window (24 hours, 2 days, 7 days, 30 days, or 90 days) from the toolbar.
- Pin an SLA by clicking its star icon, to add it to the Penalty Box.
SLA detail view
Selecting an SLA opens its detail view, which includes:
- Key performance indicators, such as availability, target, violations, and outage time.
- An availability-versus-target gauge.
- Tabs for Overview, Alarms, Service KPIs, and Outages.
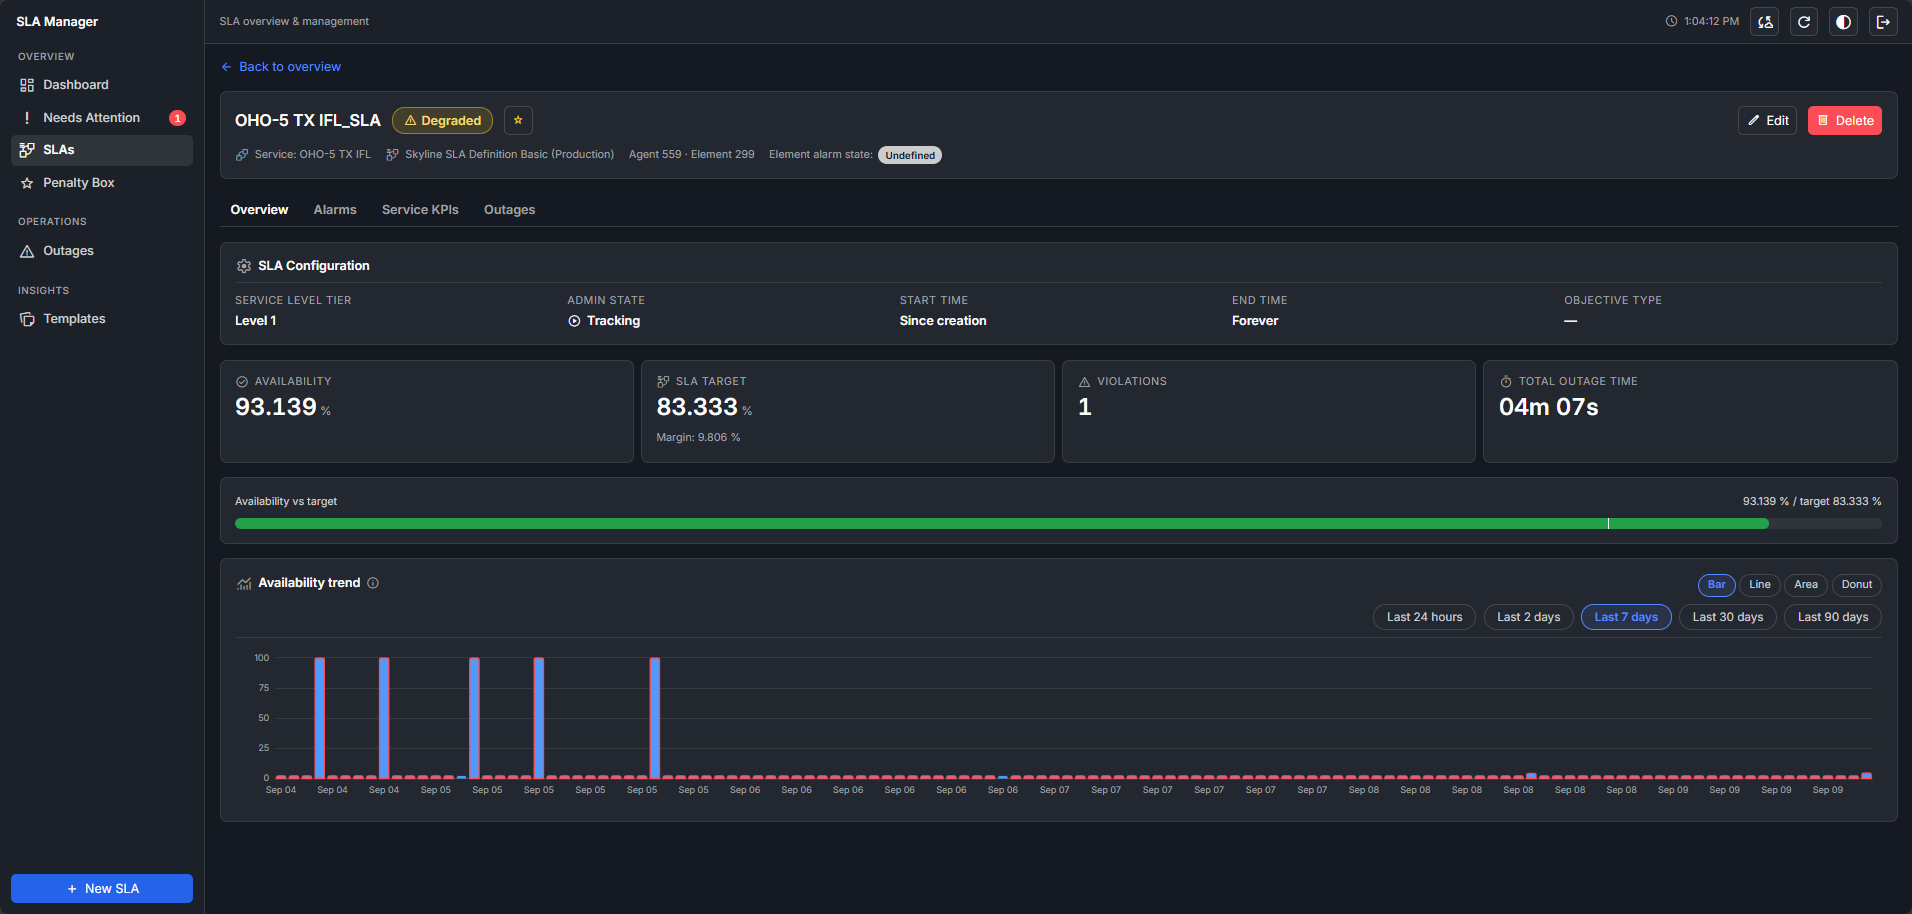
The Alarms tab shows the active alarms and 24-hour alarm history for the service tracked by the SLA.
For more information about creating, editing, deleting, and synchronizing SLAs from this page, see Managing SLAs.