Getting started with DCF
This tutorial shows how you can get started with DataMiner Connectivity Framework (DCF) based on a basic example. In this example, you will create DCF connections between elements that expose external DCF interfaces and visualize them using a Visio-based overview in Cube and a node edge graph in a dashboard.
The content and screenshot of this tutorial were created in DataMiner version 10.4.11.
Expected duration: 20 minutes
Tip
See also: Kata #45: DataMiner Connectivity Framework (DCF) on DataMiner Dojo.
Prerequisites
- A DataMiner System that is connected to dataminer.services.
- Make sure the GenericInterface soft-launch option is enabled. See Soft-launch options.
Tip
If you use a DaaS system, these prerequisites are automatically met.
Objective
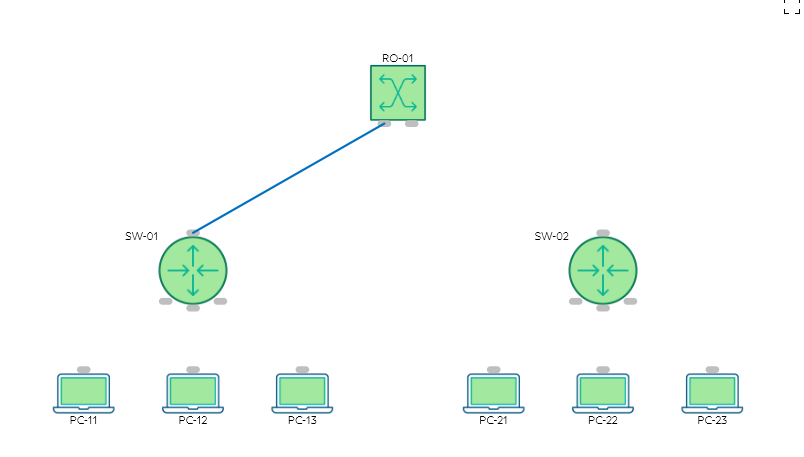
The objective of this tutorial is to build the following network connectivity diagram in a visual overview and a node edge graph using DCF:
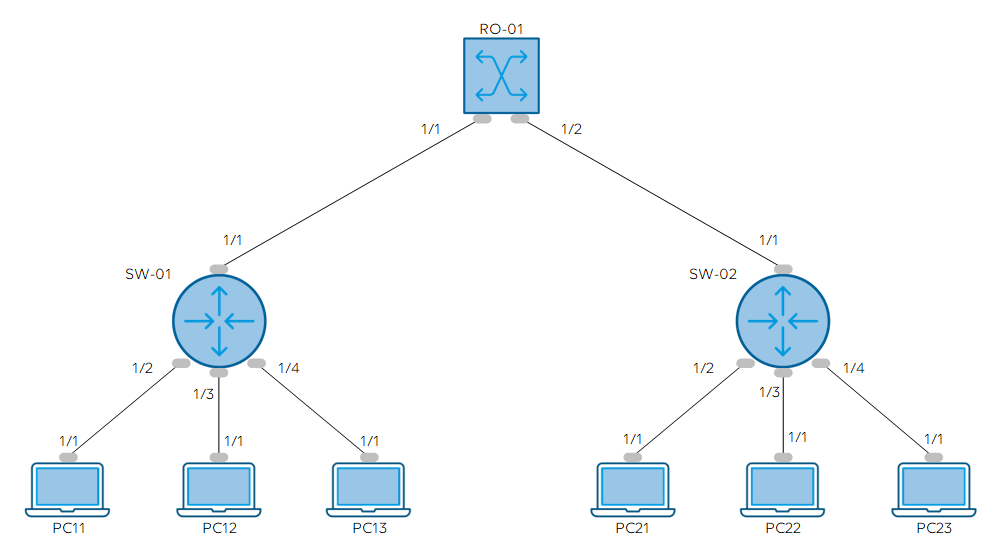
Where:
- RO-x: Router
- SW-x: Switch
- 1/x: Represents the port number from the device
For example, from the diagram you can infer the following:
- RO-01 connects to SW-01 using the interface Port Ethernet 1/1.
- SW-01 connects to RO-01 using the interface Port Ethernet 1/1.
- SW-01 connects to PC-11 using the interface Port Ethernet 1/2.
- PC-11 connects to SW-01 using the interface Port Ethernet 1/1.
Overview
- Step 1: Deploy the tutorial package from the catalog
- Step 2: Create external DCF connections
- Step 3: Create a node edge graph
- Step 4: Configure the nodes
- Step 5: Configure the edges
- Step 6: Display KPIs related to a connection
Step 1: Deploy the tutorial package from the Catalog
To deploy the package:
Go to the Kata DCF package in the Catalog.
Click the Deploy button to deploy the package on your DMA.
The package will deploy the following components:
The Generic Data Simulator connector, which exposes DCF interfaces and will be used by the elements created for this tutorial.
The SLC-AS-Kata-DCF Automation script, which will be used to provision the view and elements required for this tutorial.
The kata_dcf_view.vsdx Visio file, which will be used to visualize DCF connections in Cube.
The KATA_DCF dashboard, located in the dashboard folder with the same name. This is a blank dashboard containing the following GQI queries, which are required to create the node edge graph for this tutorial:
- DCF_ELEMENTS: The nodes representing the routers, switches, and PCs available in the network diagram.
- DCF_INTERFACES: The DCF interfaces exposed by the elements created for this tutorial
- DCF_CONNECTIONS: The DCF connections created for this tutorial
When the package has been fully deployed, in the Automation module in DataMiner Cube, go to the folder Kata DCF and execute the script SLC-AS-Kata-DCF to provision the components required for this tutorial.
Tip
See also: Manually executing a script
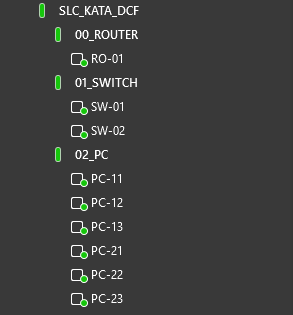
When the script is complete, the following items should become available in the Surveyor:
- Views:
- SLC_KATA_DCF
- 00_ROUTER
- 01_SWITCH
- 02_PC
- Elements:
- RO-01
- SW-01
- SW-02
- PC-11
- PC-12
- PC-13
- PC-21
- PC-22
- PC-23
- Views:
In the Cube Surveyor, select the view SLC_KATA_DCF.
Right-click the VISUAL page, select Set as active Visio file > Existing, and select the file kata_dcf_view.vsdx.
If you cannot see that Visio file listed in the window, click Other file and browse to the folder
C:\Skyline DataMiner\Views. You will be able to select the file there. If you do not have access to this folder, restarting the DMA will also make the Visio file become available in the window.Tip
See also: Editing a Visual Overview in DataMiner Cube.
Step 2: Create external DCF connections
Define connections between the router and switches:
In the 00_ROUTER view, right-click the element RO-01, and select Properties.
In the Properties window, go to the connectivity > external tab.
In the State column, select Connected to for the interface Port Ethernet 1/1.
In the External column, select the element SW-01.
In the Interface column on the right, select the interface Port Ethernet 1/1.
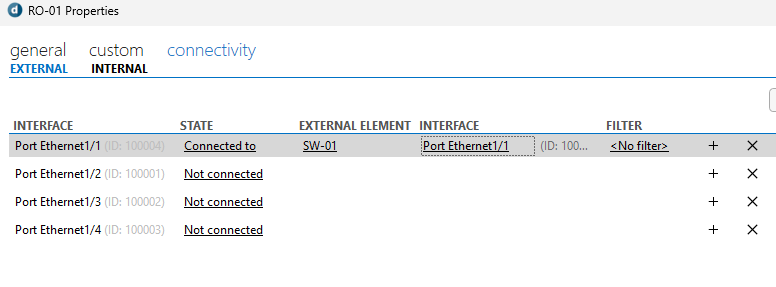
Click the Apply button in the lower right corner.
This will apply your changes and create the connection. The VISUAL page of the SLC_KATA_DCF view will display the DCF connection.
Still in the Properties window, in the State column, select Connected to for the interface Port Ethernet 1/2.
In the External column for this interface, select the element SW-02.
In the Interface column on the right, select the interface Port Ethernet 1/1.
Click Apply.
This new connection should now also be displayed in the visual overview.
Click OK to close the Properties window.
Define connections between the switches and PCs:
In the 01_SWITCH view, right-click the element SW-01, and select Properties.
In the Properties window, go to the connectivity > external tab.
You will notice that there already is a connection for interface Port Ethernet 1/1. This is because DCF creates both connections on both ends.
In the State column, select Connected to for the interface Port Ethernet 1/2.
In the External column, select the element PC-11.
In the Interface column, select the interface Port Ethernet 1/1.
Click Apply.
The new connection should be displayed in the visual overview.
In the same way as detailed above, create the remaining connections according to the diagram above.
Note
Before you proceed to the next step, make sure all the DCF connections shown in the diagram have been created.
Step 3: Create a node edge graph using DCF connections
Go to the Dashboards app.
In the pane on the left, in the KATA_DCF folder, select the KATA_DCF dashboard.
Click the pencil icon in the dashboard header bar to start editing the dashboard.
Drag a Node edge graph visualization from the pane on the left onto the dashboard.
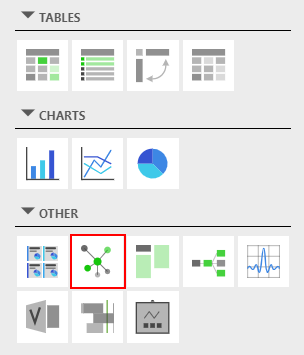
Drag the edges of the node edge graph component to resize it so that it will be large enough to easily show all nodes in the diagram.
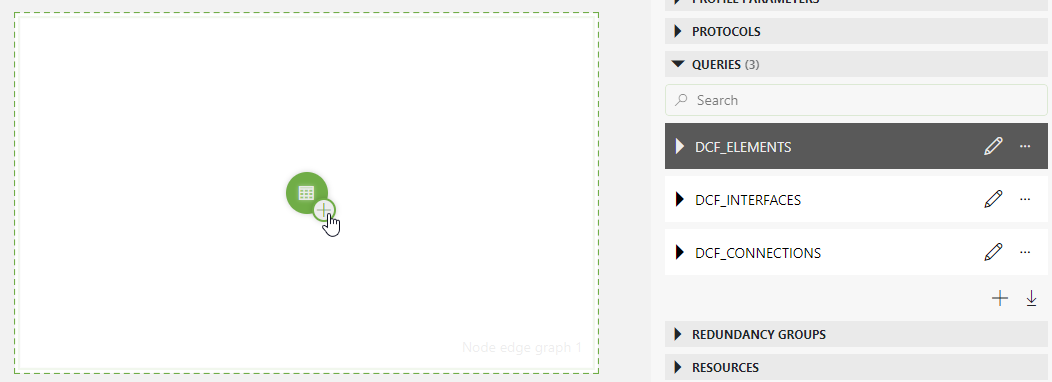
In the Data pane on the right, expand the Queries node, and drag the following queries to the node edge graph component:
DCF_ELEMENTS: This GQI query contains the nodes
DCF_CONNECTIONS: This GQI query contain the connections between the nodes
Note
Although the GQI query DCF_INTERFACES is not used directly in the node edge graph, it is used by the GQI query DCF_CONNECTIONS. The GQI query DCF_INTERFACES contains the link between the DCF interfaces and the parameters from the element.
Step 4: Configure the nodes
Select the node edge graph component you have added.
Select the Settings pane on the right.
The queries you added earlier will be listed under Unassigned queries.
Under the query DCF_ELEMENTS, select Set as node.
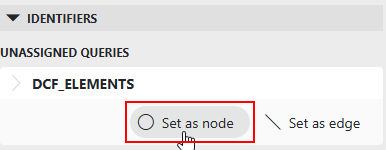
The selected query will be moved to the bottom of the pane.
For the same query, make sure Node ID column is set to the column Element ID.
This indicates that the Element ID column contains the ID representing the different entities that should be shown as nodes.
Nine nodes should now be displayed in the node edge graph component, representing the router, switches, and PCs. By default, the icon displayed for each node is a circle.

Add an override for the router node:
Click Add override.
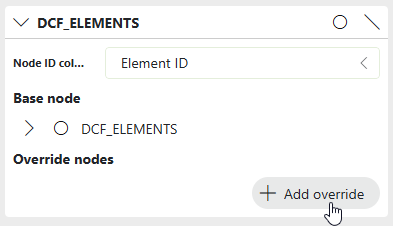
In the Filter box, select Description. A text box will now be displayed to right of the filter.
In the text box, specify
ROUTER.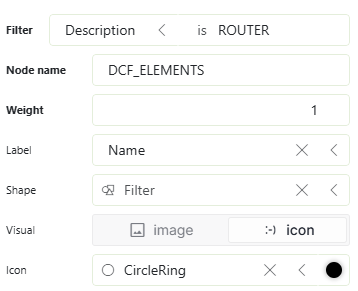
In the Weight box, specify
3.This will ensure that the node representing the router is positioned at the top of the component. This is because with the default layout settings, the higher the weight of a node, the higher the position of the node in the graph.
In the Shape box, select Hexagon.
The node representing the router will now have a hexagon shape. Optionally you can also change the color of the shape by clicking the colored circle to the right of the Shape box
In the Icon box, select the icon NetworkDeviceScanning.
Note
To quickly find a specific icon in the list, start typing the name of the icon in the box.
In the Label box, make sure Name is selected.
The name of the device should now be displayed below the nodes.

Add an override for the switch nodes:
Click Add Override again.
In the Filter box, select Description, and enter the value
SWITCHin the box on the right.Set the Weight to 2.
This will ensure that the nodes representing the switches are positioned below the router node.
In the Shape box, select Decagon.
The node representing the switch will now have a decagon shape. Optionally, you can also change the color of the shape by clicking the colored circle to the right of the Shape box.
In the Icon box, select Switch.
In the Label box, make sure Name is selected.
The nodes should now look like this:

Add an override for the PC nodes:
Click Add Override again.
In the Filter box, select Description, and enter the value
PCin the box on the right.Keep the Weight set to 1.
This will ensure that the nodes representing the switches are positioned below the switch node.
In the Shape box, select Circle.
The node representing the switch will now have a circle shape. Optionally, you can also change the color of the shape by clicking the colored circle to the right of the Shape box.
In the Icon box, select ThisPC.
In the Label box, make sure Name is selected.
The nodes should now look like this:

Step 5: Configure the edges
At the top of the Unassigned queries list, under the query DCF_CONNECTIONS, select Set as edge.
The query will be moved to the bottom of the pane.
In the Source box, make sure Source element ID is selected.
In the Destination box, make sure Destination element ID is selected.
The edges connecting the router and switches will now be displayed in the node-edge graph visualization.
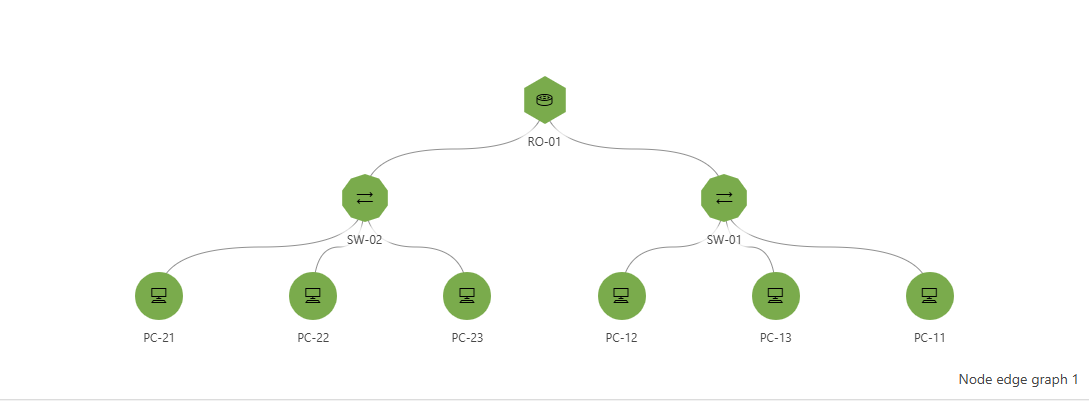
Step 6: Display KPIs related to a connection
By default, when you click a connection in the graph, all the information related to the connection is displayed:
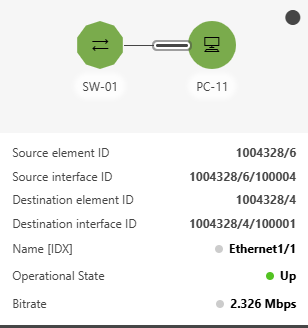
In this step, you will limit the displayed information so that only the parameters Operational State and Bitrate will be shown in the connection details.
In the data pane, expand Queries > DCF_CONNECTIONS.
The different columns of the DCF_CONNECTIONS query will be shown.
Drag and drop the columns Bit Rate and Operational State to the node edge graph component as filters.

Click the pencil icon in the dashboard header again to stop editing the dashboard.
Select a connection on the dashboard.
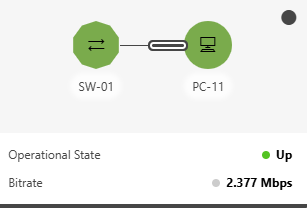
Only the following properties should now be shown:
