Viewing the current Failover DMA status
In the Failover Config window, the current status of the two DMAs is displayed by means of LEDs, which are refreshed once a minute.
These LEDs can have one of the following three colors:
Green: No problems detected.
Red: A problem has been detected.
Transparent: Status information is being retrieved.
To view more detailed information about the Failover status, click the Status button  at the bottom of the dialog box. This will open the Status window.
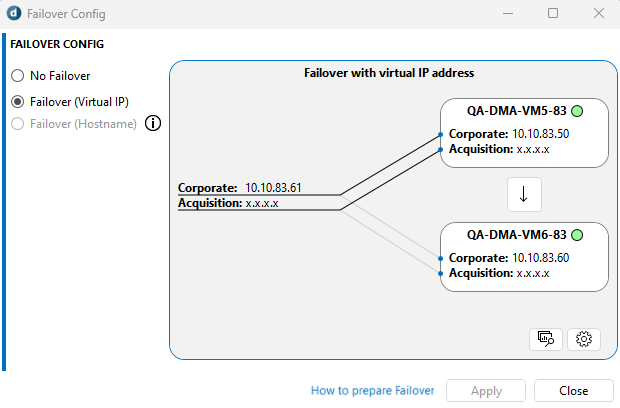
The Failover Config window in DataMiner 10.4.10
From DataMiner 10.4.10/10.5.0 onwards, the Failover Config window can also display information about problems with the installation of the packet capture libraries on the DMA you are currently connected to. If there is a problem with these libraries, an information icon ![]() will be displayed next to Failover (Virtual IP), as these are highly recommended for a Failover setup based on virtual IP. If you then hover the mouse pointer over the icon, you will see one of the following messages:
will be displayed next to Failover (Virtual IP), as these are highly recommended for a Failover setup based on virtual IP. If you then hover the mouse pointer over the icon, you will see one of the following messages:
No Pcap libraries have been found on this DataMiner Agent: Neither Npcap (recommended) nor WinPcap is installed on the DMA. In this case, we do not recommend using this Agent in a Failover setup with virtual IP addresses.
No Pcap libraries could be detected on this DataMiner Agent: There was a problem detecting the presence of the Npcap (recommended) or WinPcap libraries. In this case, we recommend verifying and ensuring that either of the packet capture libraries is installed on the DMA in case it is to be used in a Failover setup with virtual IP addresses.
The Failover Status window
The Failover Status window displays status parameters for both DMAs.
Failover Status: "Online", "Offline", "Going Online", etc. This parameter does not have a color.
Configuration: "Valid" or "Invalid"
"Invalid" means that there is some kind of problem with the Failover configuration. In that case, more information can be found in the Failure Reason column.
Heartbeat/Inverted Heartbeat/Ping to XX.XX.XX.XX: "Success" or "Failing"
In case of "Failing", a reason and count will be displayed. The time of the last successful heartbeat/ping is also listed.
Sync Connection: "Available" or "Not Available"
In case of "Not Available", a reason will be displayed. This status is only available for the DMA that is currently online.
DB Sync: "Active" or "Failing". Only displayed in case self-hosted data storage is used.
"Active" means there has been at least one successful forward operation.
"Failing" means there is a problem with the forwarding of alarm events to the backup DMA. More information will be displayed in the Failure Reason column. The time of the last successful DB Sync check is also listed. This status is only available for the DMA that is currently online.
Tip
See also: Viewing DMA synchronization information
DB Sync Stack: "OK" or "Too Large". Only displayed in case self-hosted data storage is used.
When this status is in error, but the DB Sync status is not, the sync might be going on, but it might not be able to keep up. The number of queries/files left to be forwarded is also listed between brackets. This status is only available for the DMA that is currently online.
RTE Count: The current number of runtime errors on the DataMiner Agent.
NIC X: "Available" or "Unavailable"
These items provide information about the network interfaces. They are only present after an NIC has been disconnected or reconnected.
Database: "OK" or "Failing"
This status is the result of the following database query:
select count(*) from slenumvalues"Failing" means that the database server is probably not running or that there is a configuration issue.
Note
- For some of these parameters, extra information can be displayed. For example, for heartbeats or DB sync, you will also see the "last success" time and, in case of failure, the reason for that failure.
- If no status information can be retrieved from a DMA, you will notice an Agent Status item with the value "Unreachable".
- If a Cassandra cluster per DMA is used, and both database instances are down, the system will fall back to file offloading. See also: Switching to Cassandra in a Failover setup. Note that we recommend switching to Storage as a Service instead.