Using an SLA to monitor a power service
In this tutorial, you will learn how to configure and use a Service Level Agreement (SLA) to monitor a power service. The steps include creating an SLA using an existing service as a starting point and customizing SLA parameters to track service metrics for high availability compliance.
Additionally, you will learn how to configure an alarm template to monitor and visualize alarms for city streets affected by power service degradation.
Expected duration: 20 minutes
Tip
See also:

Note
The content and screenshots for this tutorial have been created using DataMiner version 10.4.7.
Prerequisites
- A DataMiner System that is connected to dataminer.services.
Overview
This tutorial consists of the following steps:
- Step 1: Deploy the DataMiner SLA tutorial package from the Catalog
- Step 2: Create a new SLA
- Step 3: Configure your new SLA
- Step 4: Assign and modify an alarm template
- Step 5: Analyze the SLA metrics
Step 1: Deploy the DataMiner SLA tutorial package from the Catalog
Go to https://catalog.dataminer.services/details/ac72d9e5-4c12-4408-a591-2fc2316abebf.
Deploy the Catalog item to your DataMiner Agent by clicking the Deploy button.
Tip
See also: Deploying a Catalog item to your system
Open DataMiner Cube and check whether the following items have been added to your DataMiner Agent:
A view named "DataMiner SLA tutorial" (1)
An element named "Power Monitoring - Miami" (2)
A service named "Power Service - South Beach" (3)
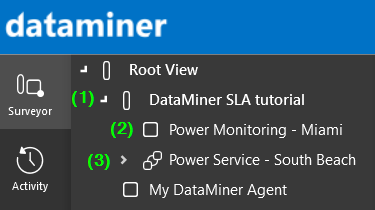
If this is the case, the package has been successfully deployed.
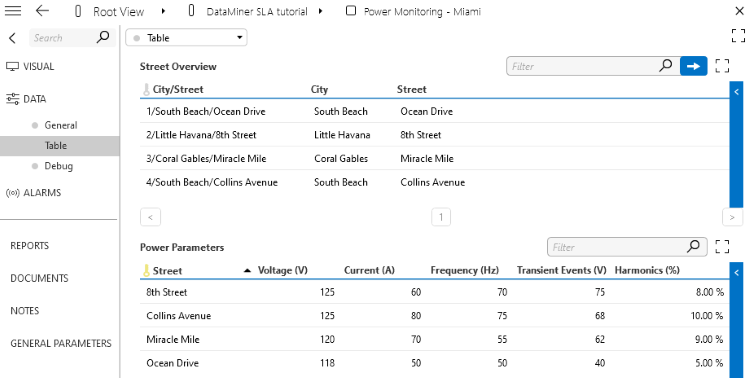
On the Data > Table page of the element, you will see that the Street Overview and Power Parameters tables contain pre-provisioned data:
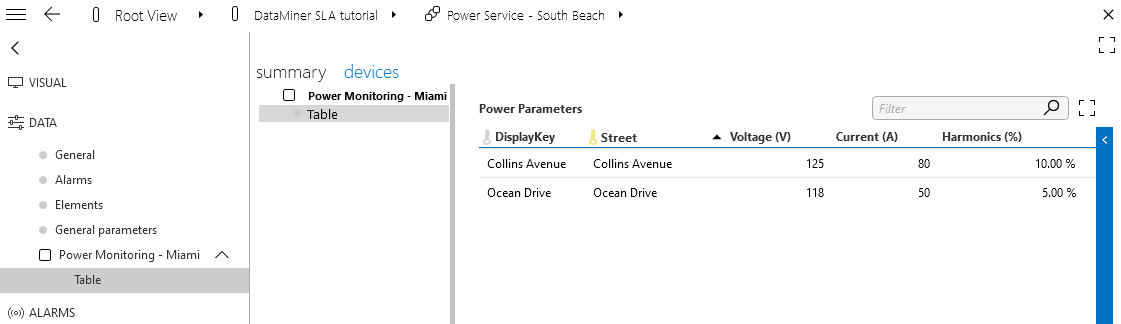
On the Data > Power Monitoring - Miami > Table page of the service, you will see that the Power Parameters table already contains two entries.
Step 2: Create a new SLA
Now that you have installed the DataMiner SLA tutorial package, you will create a new Service Level Agreement (SLA).
In the Surveyor, right-click the DataMiner SLA tutorial view and select New > SLA.
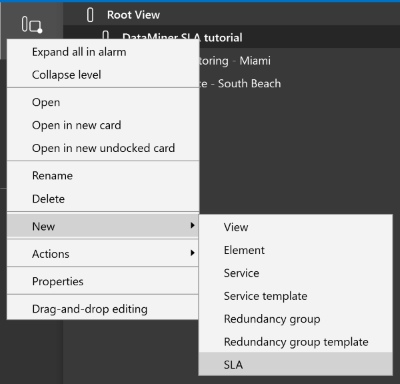
A card will open.
Specify the following information:
Name:
Power SLA - South BeachService:
Power Service - South BeachProtocol:
Skyline SLA Definition BasicVersion: Production
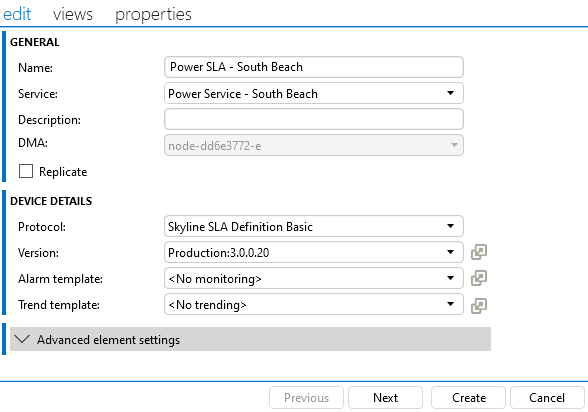
Click Create to add the SLA.
Step 3: Configure your new SLA
In this step, you will configure different data pages of your newly created SLA.
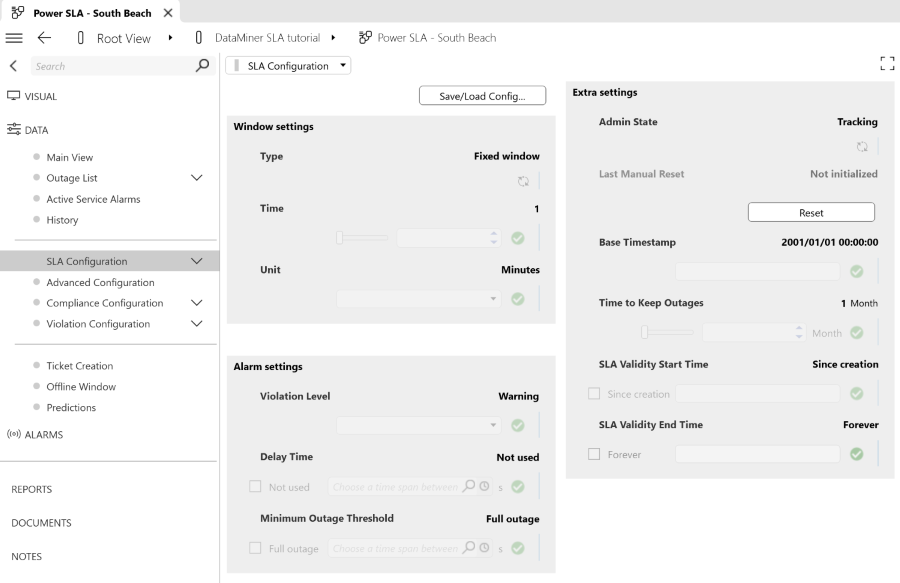
Navigate to the Data > SLA Configuration page of your SLA.
Configure the following parameters:
Window settings
Type: Fixed window
Time: 1
Unit: Minutes
Alarm settings
Violation Level: Warning
Delay Time: Not used
Minimum outage threshold: Full outage
Extra settings
Admin State: Tracking
Base Timestamp: 2001/01/01 00:00:00
Time To Keep Outages: 1 Month
SLA Validity Start Time: Since creation
SLA Validity End Time: Forever
Tip
To save all changes simultaneously, click Save all in the lower right corner.
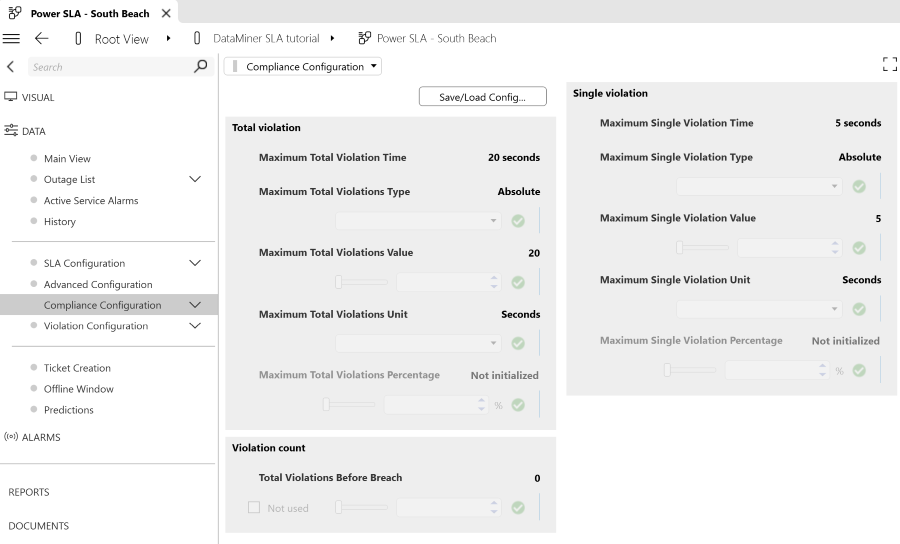
Navigate to the Data > Compliance Configuration page of your SLA.
Configure the following parameters:
Total violation
Maximum Total Violations Type: Absolute
Maximum Total Violations Value: 20
Maximum Total Violations Unit: Seconds
Violation count
- Total Violations Before Breach: 0
Single violation
Maximum Single Violation Type: Absolute
Maximum Single Violation Value: 5
Maximum Single Violation Unit: Seconds
Tip
To save all changes simultaneously, click Save all in the lower right corner.
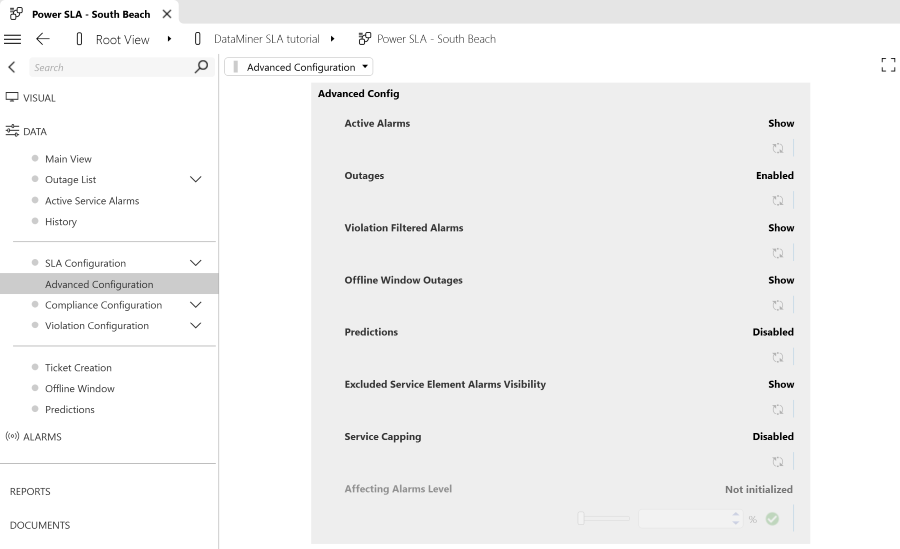
Navigate to the Data > Advanced Configuration page.
Configure the following parameters:
Active Alarms: Show
Outages: Enabled
Important
If you do not see the options to change these parameters, you may not have the sufficient parameter access level. In this case, increase your access level:
- Click the user icon in the top-right corner of the Cube header bar.
- Select System Center and navigate to Users/Groups.
- Go to the Groups tab and select the group in question.
- Enter "1" in the Group level field on the Details tab.
- Click Apply in the lower right corner of the tab.
- Close Cube and restart it.
See also: Configuring a user group
If you do not want to change the access level for the entire group, change your own override level:
- Navigate to Users/Groups > Users in System Center.
- Select the account you used to log in to the DMS.
- Enter "1" in the Override level field on the Details tab.
- Click Apply in the lower right corner of the tab.
- Close Cube and restart it.
Step 4: Assign and modify an alarm template
In the next step, you will assign an alarm template to the Power Monitoring - Miami element. This alarm template came included in the package you installed in a previous step. However, you will need to modify it.
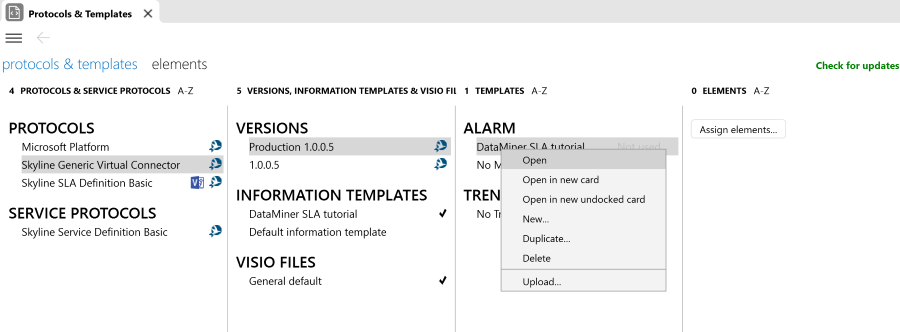
In the Cube sidebar, go to Apps > Protocols & Templates.
Under Protocols, select Skyline Generic Virtual Connector.
Under Alarm, right-click DataMiner SLA tutorial and select Open.
Configure the alarm template:
Under Table, set the Power Parameters: Voltage (V) parameter to Included.
Configure the following alarm thresholds:
In the WARN LO column, enter
115.In the NORMAL column, enter
120.
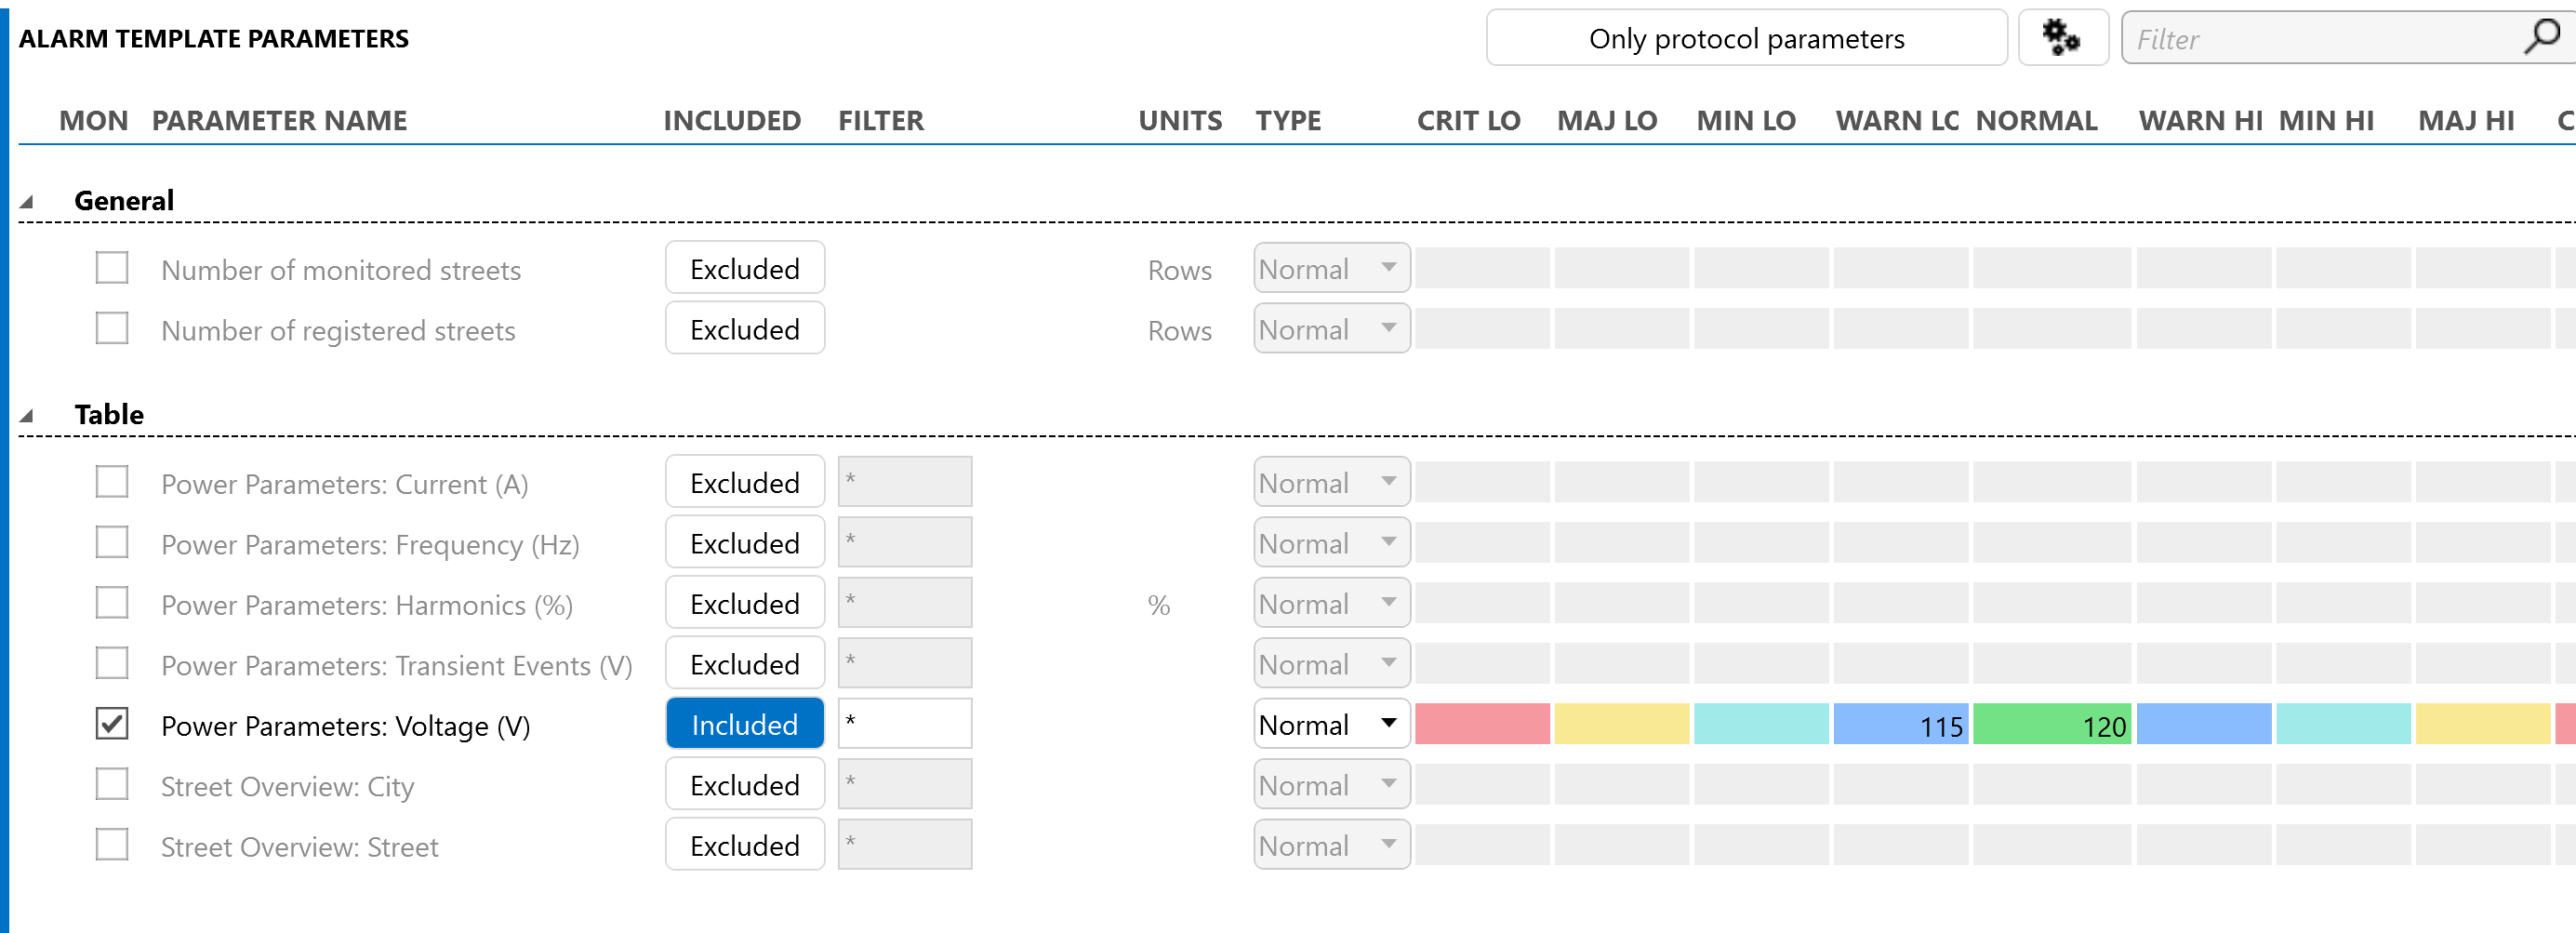
Click Apply and then OK.
In the Surveyor, right-click the Power Monitoring - Miami element and select Protocols & Templates > Assign alarm template > DataMiner SLA tutorial.
Confirm that you want to apply this alarm template.
Generate an alarm to verify whether the alarm template was correctly configured.
In the Surveyor, select the Power Monitoring - Miami element.
Go to the DATA > Table page, right-click the Ocean Drive entry in the Power Parameters table, and select Edit item.
Lower the Voltage to 115.
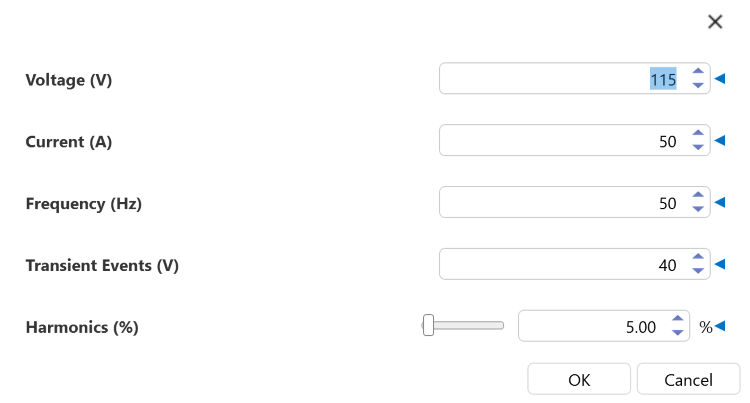
Click OK.
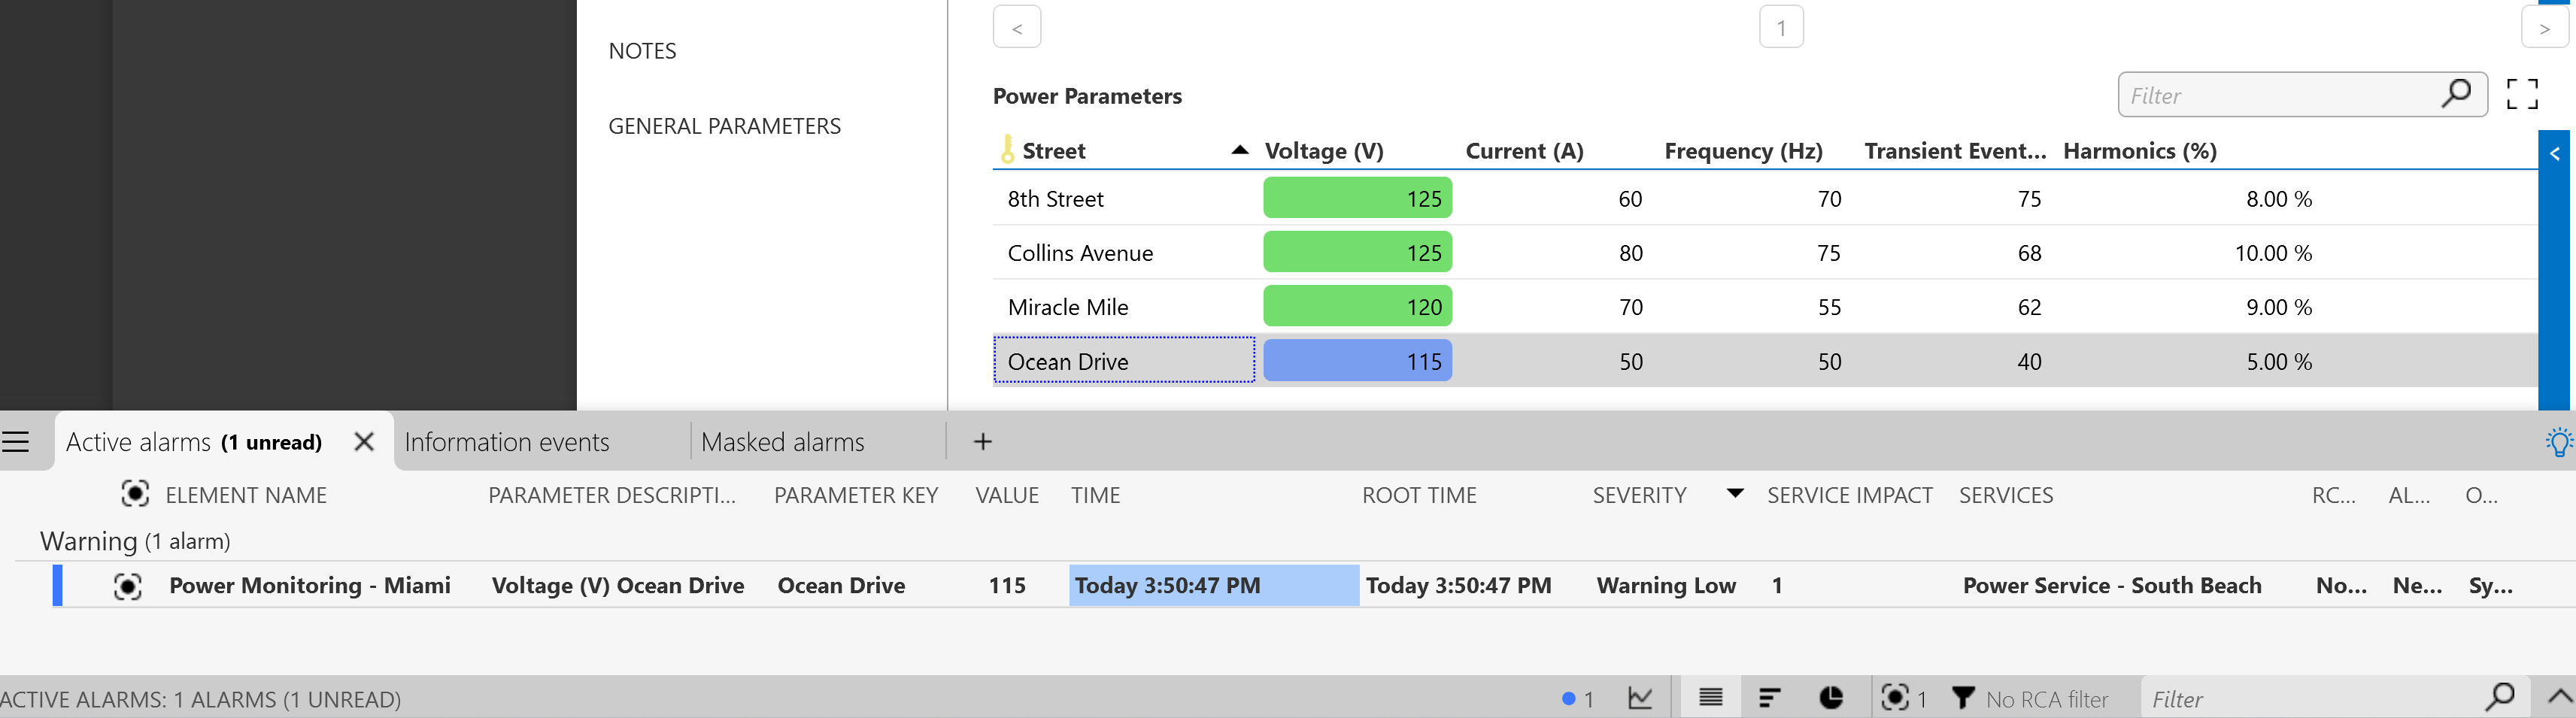
The Power Parameters table on the DATA > Table page of your element will now show an alarm in the Voltage column of the Ocean Drive entry. In the Alarm Console, you will see an alarm of severity Warning Low for the Power Monitoring - Miami element.
Step 5: Analyze the SLA metrics
In this final step, you will learn how to interpret different SLA metrics.
Go to the DATA > Main View page of the Power SLA - South Beach SLA element.
Under Compliance Info, you will see that Compliance is now set to Breached due to the simulated Voltage alarm.
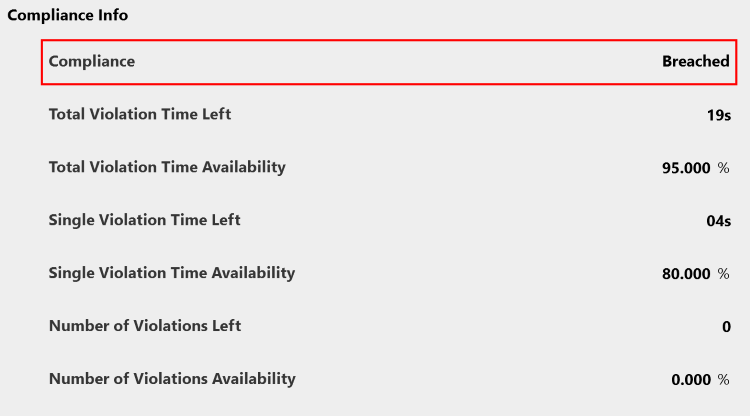
Note
It may take a few seconds before the compliance status changes from Compliant to Breached.
Restore service compliance:
Go to the DATA > Table page of the Power Monitoring - Miami element.
Right-click the Ocean Drive entry in the Power Parameters table, and select Edit item.
Set the Voltage to 120.
Click OK.
The Voltage alarm has now been cleared.
Return to the DATA > Main View page of the Power SLA - South Beach SLA element.
Under Compliance Info, the Compliance status will now be set to Compliant.
Note
It may take a few seconds before the compliance status changes from Breached to Compliant.
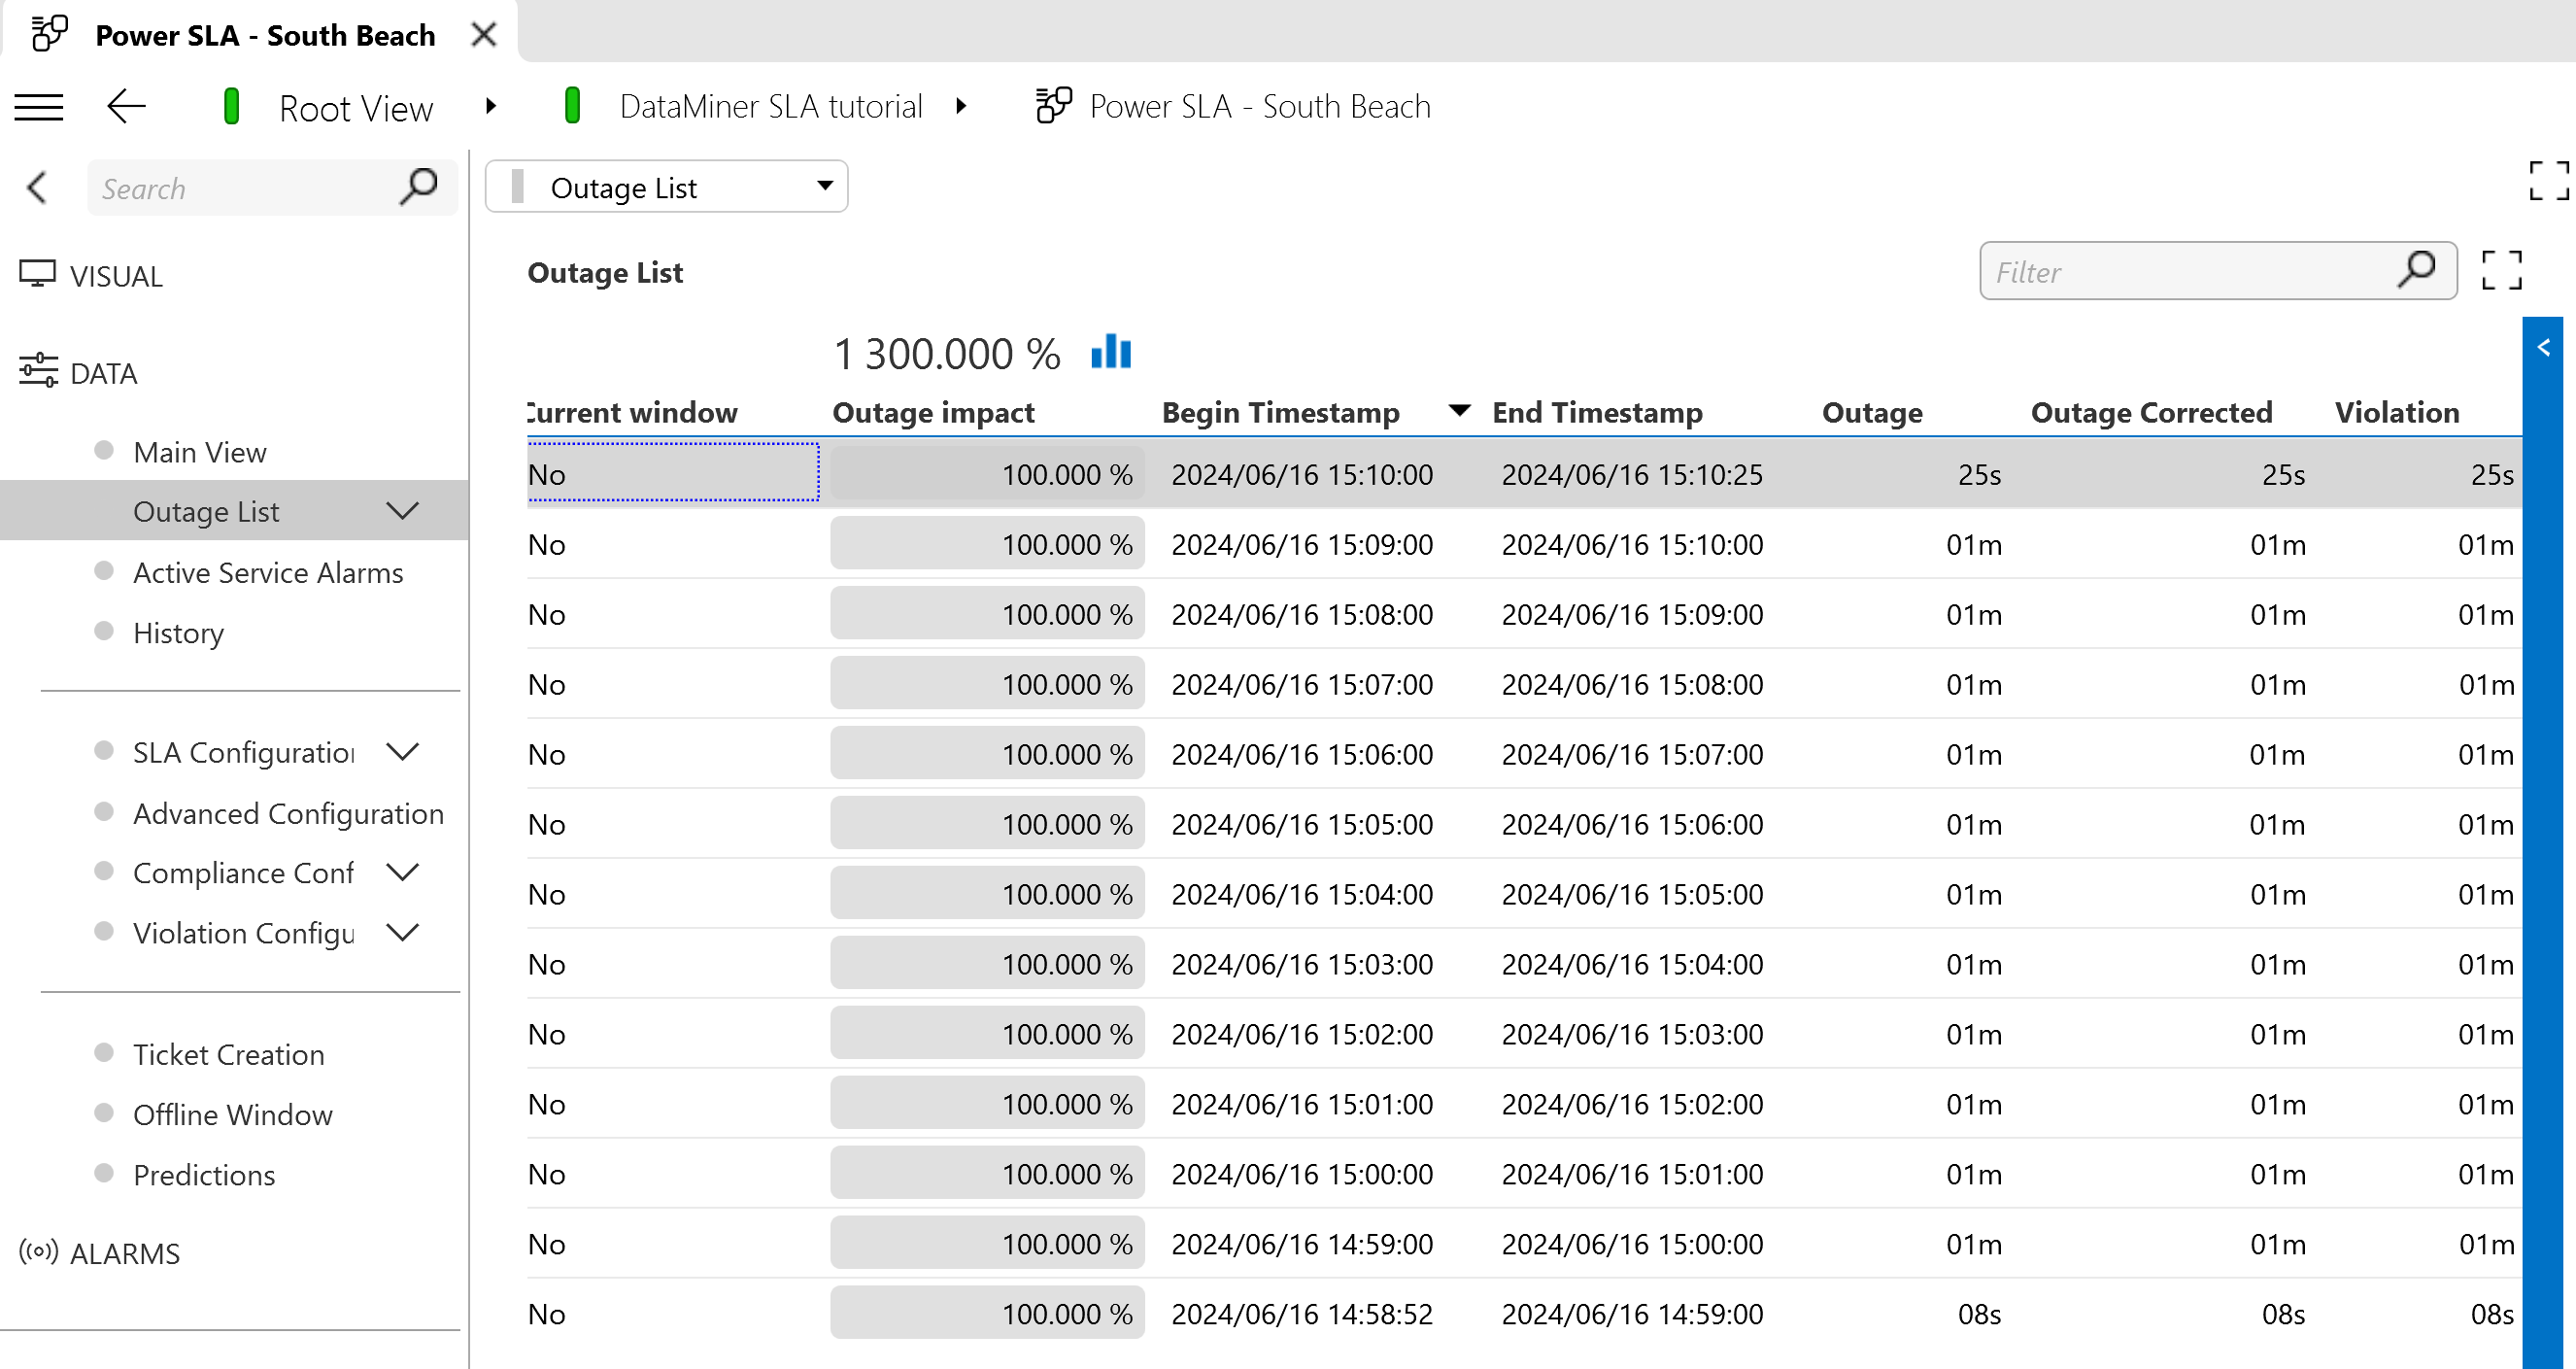
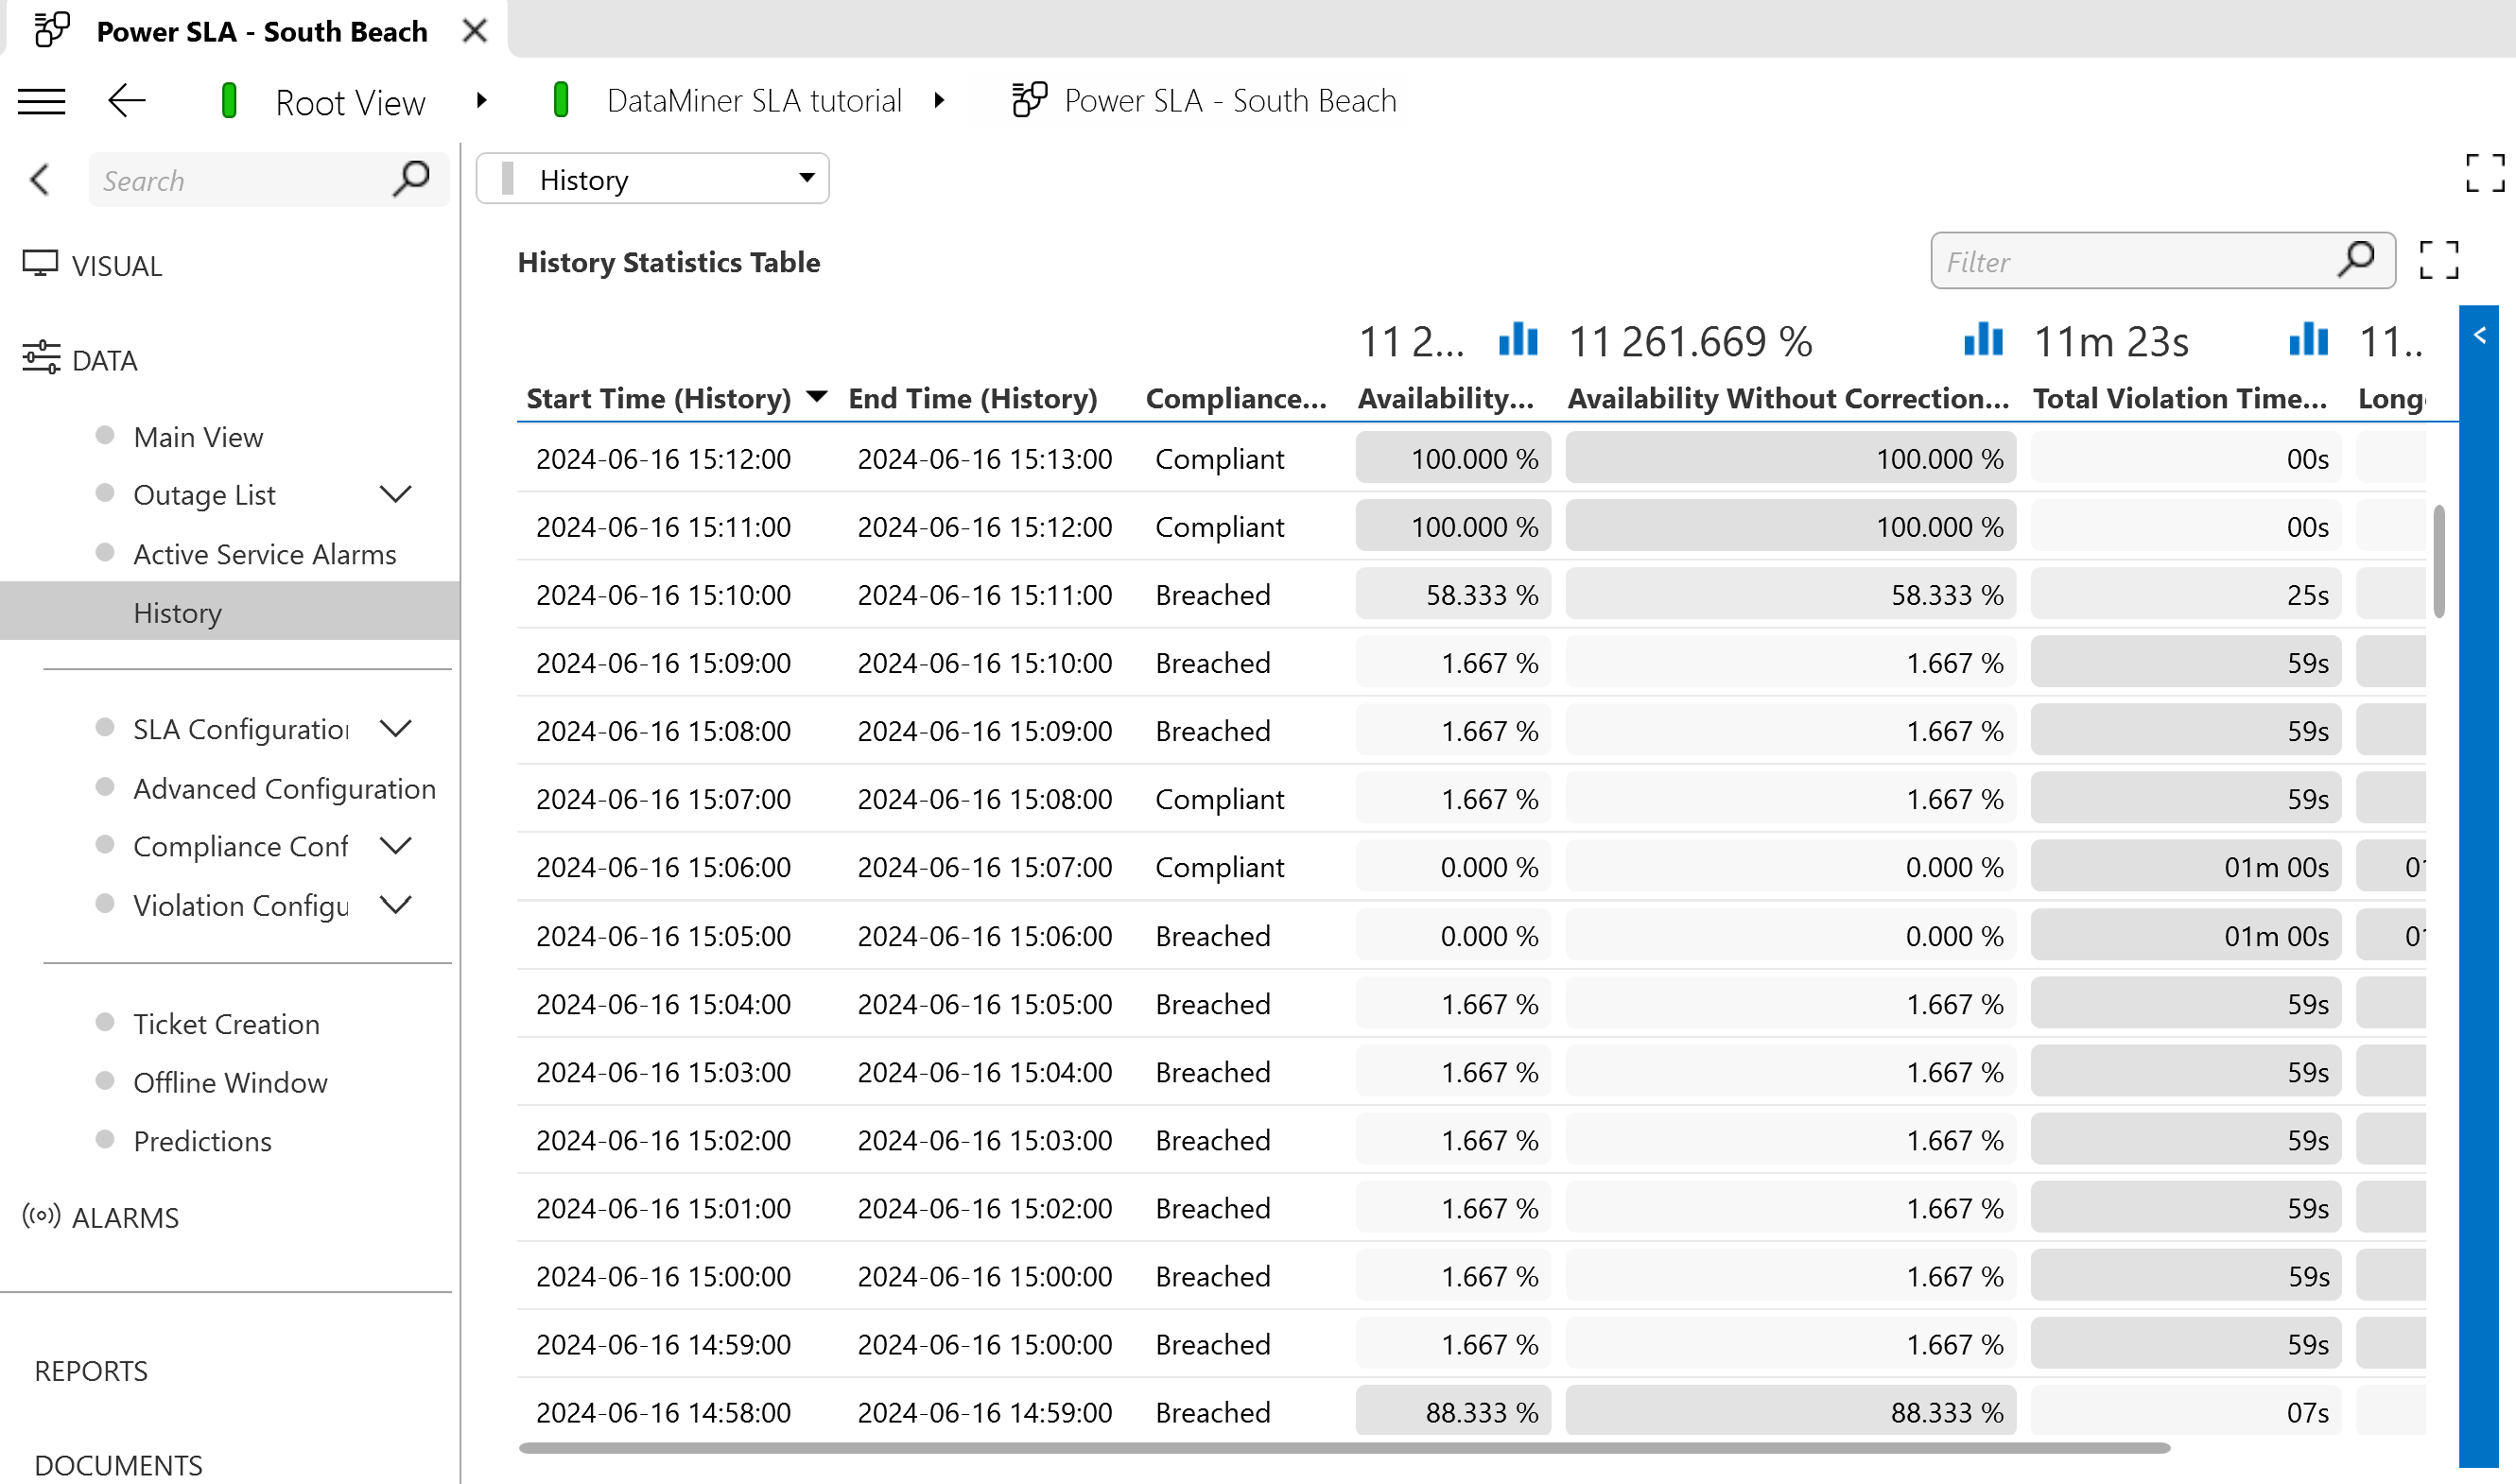
Go to the DATA > Outage List page of the SLA.
On this page, you will find a history of SLA compliance metrics.
Tip
Optionally, explore the other pages of the Power SLA - South Beach SLA element such as the Offline window and Violation Configuration pages.