Configuring components
Most dashboard or low-code app components consist of a visualization and data.
In the edit mode, visualizations are available via the panel on the left, and data is available via the Data pane on the right.
There are several ways to add a component:
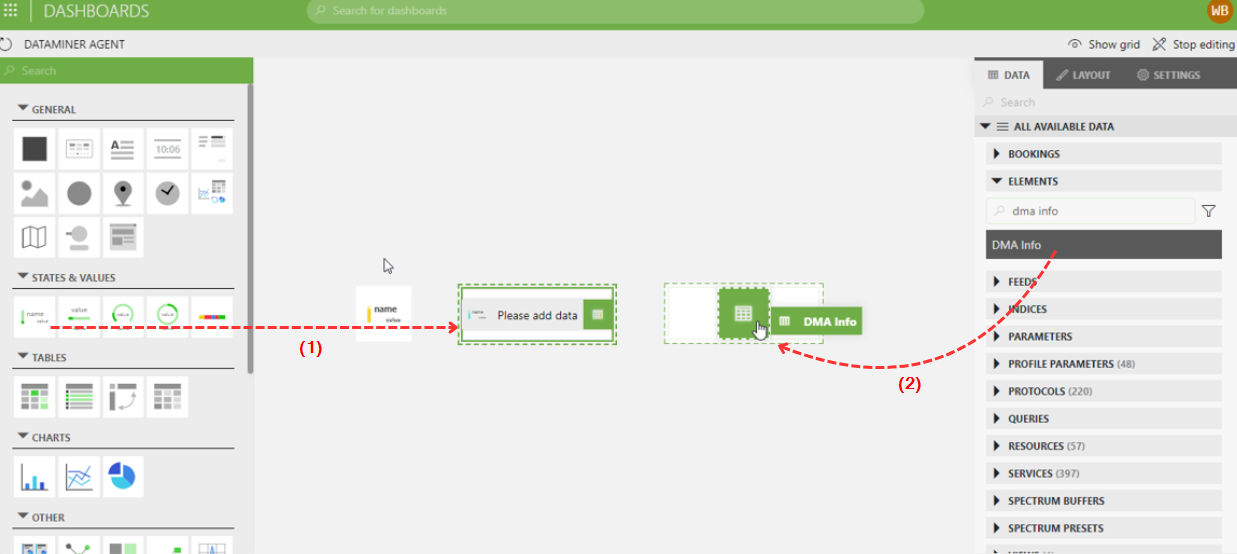
Drag a visualization from the pane on the left onto an empty section of the dashboard or low-code app page (1). Data will then need to be added to the component (2).

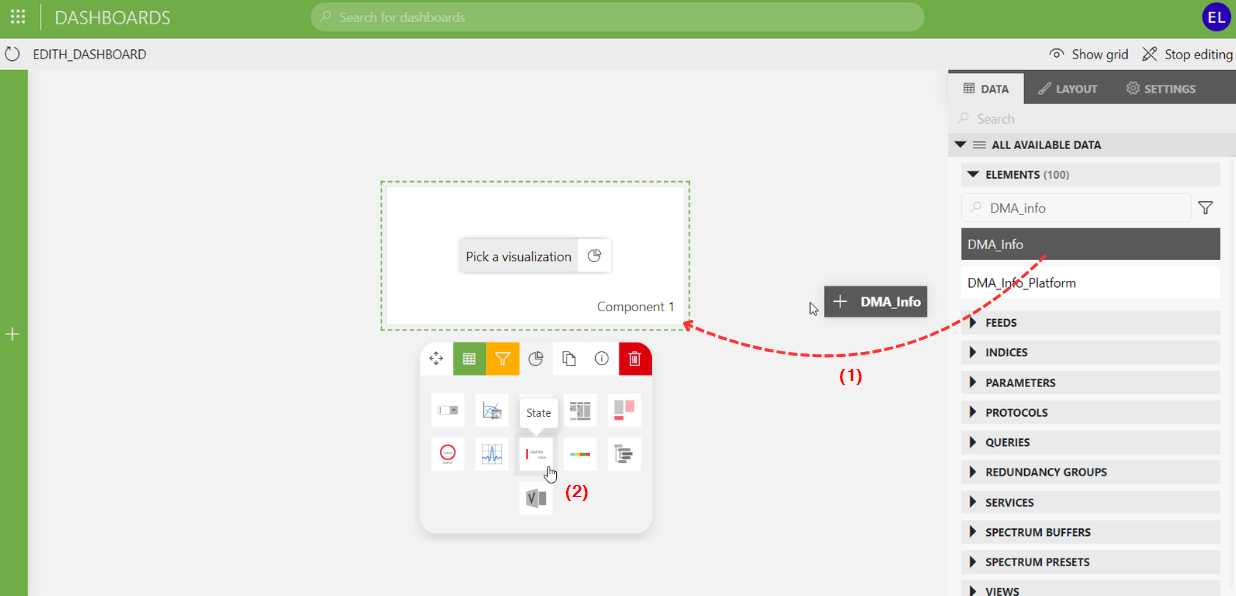
Dashboards app in DataMiner 10.4.5Drag data from the Data pane on the right onto an empty section of the dashboard or low-code app page (1). A visualization will then still need to be applied to the component (2).

Dashboards app in DataMiner 10.4.5
The following actions are then possible to configure the component:
In addition, depending on the visualization, additional configuration options may be available. For more information, refer to the relevant section in Available visualizations, or click the component or hover the mouse pointer over the component and click the ![]() icon (available from DataMiner 10.3.0 [CU11]/10.4.2 onwards).
icon (available from DataMiner 10.3.0 [CU11]/10.4.2 onwards).