Getting started with node edge graphs
This tutorial shows how you can get started with the node edge graph component based on a basic example. In this example, a node edge graph component will be used to build a basic network diagram using GQI queries. This tutorial uses a dashboard, but you can also create node edge graphs in a low-code app.
The content and screenshots of this tutorial were created in DataMiner version 10.4.3.
Expected duration: 20 minutes
Tip
See also: Kata #17: Node edge component on DataMiner Dojo 
Prerequisites
- A DataMiner System using DataMiner 10.1.5/10.2.0 or higher, which is connected to dataminer.services.
Note
Depending on your DataMiner version, you may need to activate the ReportsAndDashboardsPTP soft-launch option to be able to use the node-edge graph component. See Soft-launch options.
Tip
If you use a DaaS system, these prerequisites are automatically met.
Overview
- Objective
- Step 1: Deploy the package from the catalog
- Step 2: Add the node edge graph component
- Step 3: Configure the router and switch nodes
- Step 4: Configure the edges between router and switch nodes
- Step 5: Add nodes representing PCs
- Step 6: Configure the edges connecting the PCs and switches
Objective
The objective of this tutorial is to build the following network connectivity diagram in a node edge graph:
flowchart TD

  RO-01 --- SW-01
  RO-01 --- SW-02
  SW-01 --- PC-11
  SW-01 --- PC-12
  SW-01 --- PC-13
  SW-02 --- PC-21
  SW-02 --- PC-22
  SW-02 --- PC-23
Where:
- RO-x: Router
- SW-x: Switch
- PC-x: PC
Step 1: Deploy the tutorial package from the catalog
To deploy the package:
Go to the Kata Node Edge package in the DataMiner Catalog.
Click the Deploy button to deploy the package on your DMA.
While the package is being deployed, you can follow the progress of the deployment in the Admin app, on the Deployments page for your DMS. Make sure to use the Refresh button in the top-left corner.
The package contains the following components:
Automation script JSON Reader: You will be able to find this in the Automation module, in the folder Automation Scripts/GQI/Data sources.
Provisioning files: These will be available in the Documents module, in the folder GQI data sources.
list_pc.json: List of PCs.
list_network_devices.json: List of network devices (switch, router).
list_connection_single.json: List of connections between devices (single connection).
list_connection_bidirectional.json: List of connection between devices (double connection).
This file contains two connections per physical connection, i.e. one connection from source to destination and another connection from destination to source.
list_interface.json: List of interfaces exposed by each device.
list_router.json: List of routers (included in list_network_devices).
list_switch.json: List of switches (included in list_network_devices).
Dashboards: These will be located in the folder KATA.
Node_Edge: A blank dashboard containing all GQI queries required to create the node-edge diagram for this tutorial.
Node_Edge_Extra: A dashboard similar to the previous dashboard, with additional GQI queries for more complex diagrams. This will not be used for this tutorial.
The dashboard Node_Edge contains the following GQI queries:
Node_Network_Devices: The nodes representing the switches and routers available in the network diagram.
Node_PC: The nodes representing the PCs available in the network diagram.
Edges: The connections displayed in the network diagram.
Interface: The interfaces exposed by the devices in the network diagram (not used in this tutorial).
Edge_With_Interface: The connections displayed in the network diagram, with extra information per connection. As the name suggest, this GQI query is built from the GQI queries Edges and Interfaces. This GQI query will not be used in this tutorial.
Step 2: Add the node edge graph component
When the package has been deployed, go to the Dashboards app.
In the pane on the left, navigate to KATA > NODE_EDGE to open the Node_Edge dashboard.
Click the pencil icon in the dashboard header bar to start editing the dashboard.
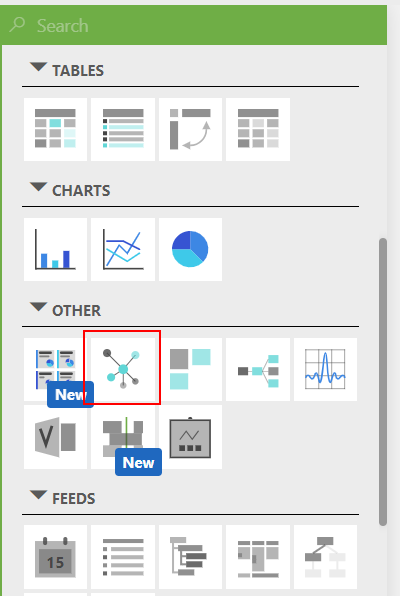
Drag a Node edge graph visualization from the pane on the left onto the dashboard.
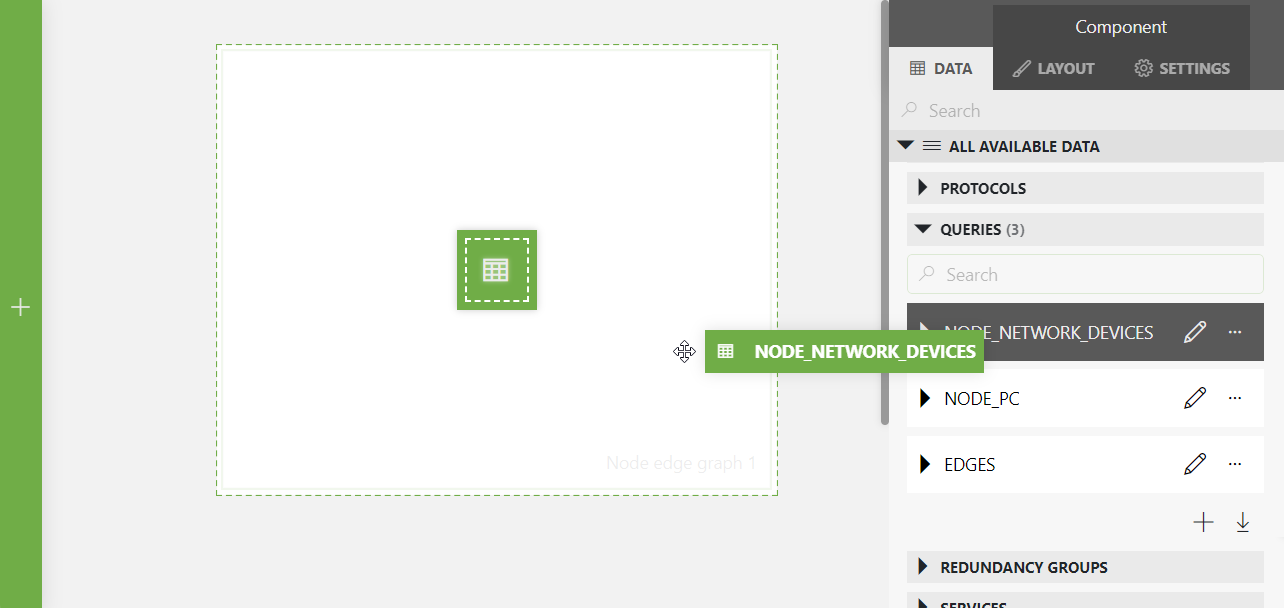
In the Data pane on the right, expand the Queries node, and drag the following queries to the visualization you have just added:
Node_Network_Devices
Edges
Step 3: Configure the router and switch nodes
Click the node edge graph component you have added to select it.
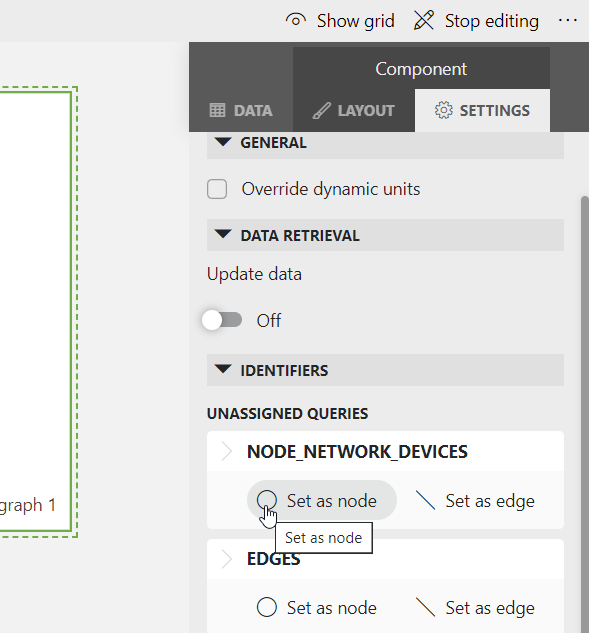
Select the Settings pane on the right.
The queries you added earlier will be listed under Unassigned queries.
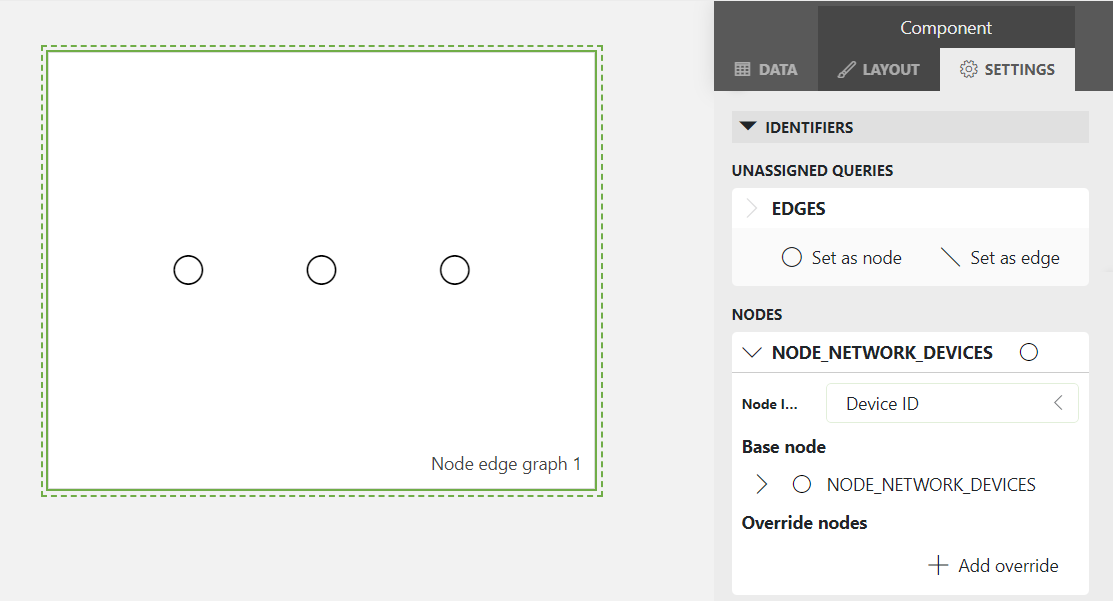
Under the query Node_Network_Devices, select Set as node.
The selected query will be moved to the bottom of the pane.
For the same query, set Node ID column to the column Device ID.
This way, you indicate that the Device ID column contains the IDs representing the different entities that should be shown as nodes.
Three nodes will now be displayed in the node edge graph component, representing a router and two switches. By default, the icon displayed for each node is a circle.
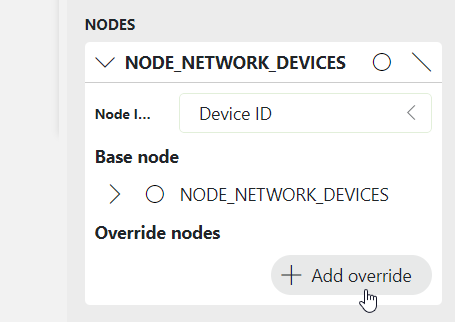
Add an override for the router node:
Click Add override.
In the Filter box, select Type.
A text box will now be displayed to the right of the filter.
In the text box, specify
Router.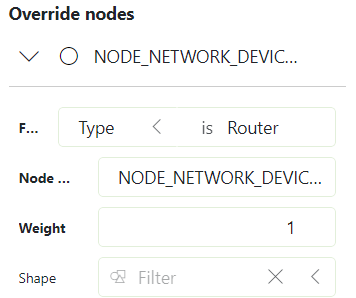
In the Weight box, specify
2.This will ensure that the node representing the router is positioned at the top of the component. This is because with the default layout settings, the higher the weight of a node, the higher the position of the node in the graph.
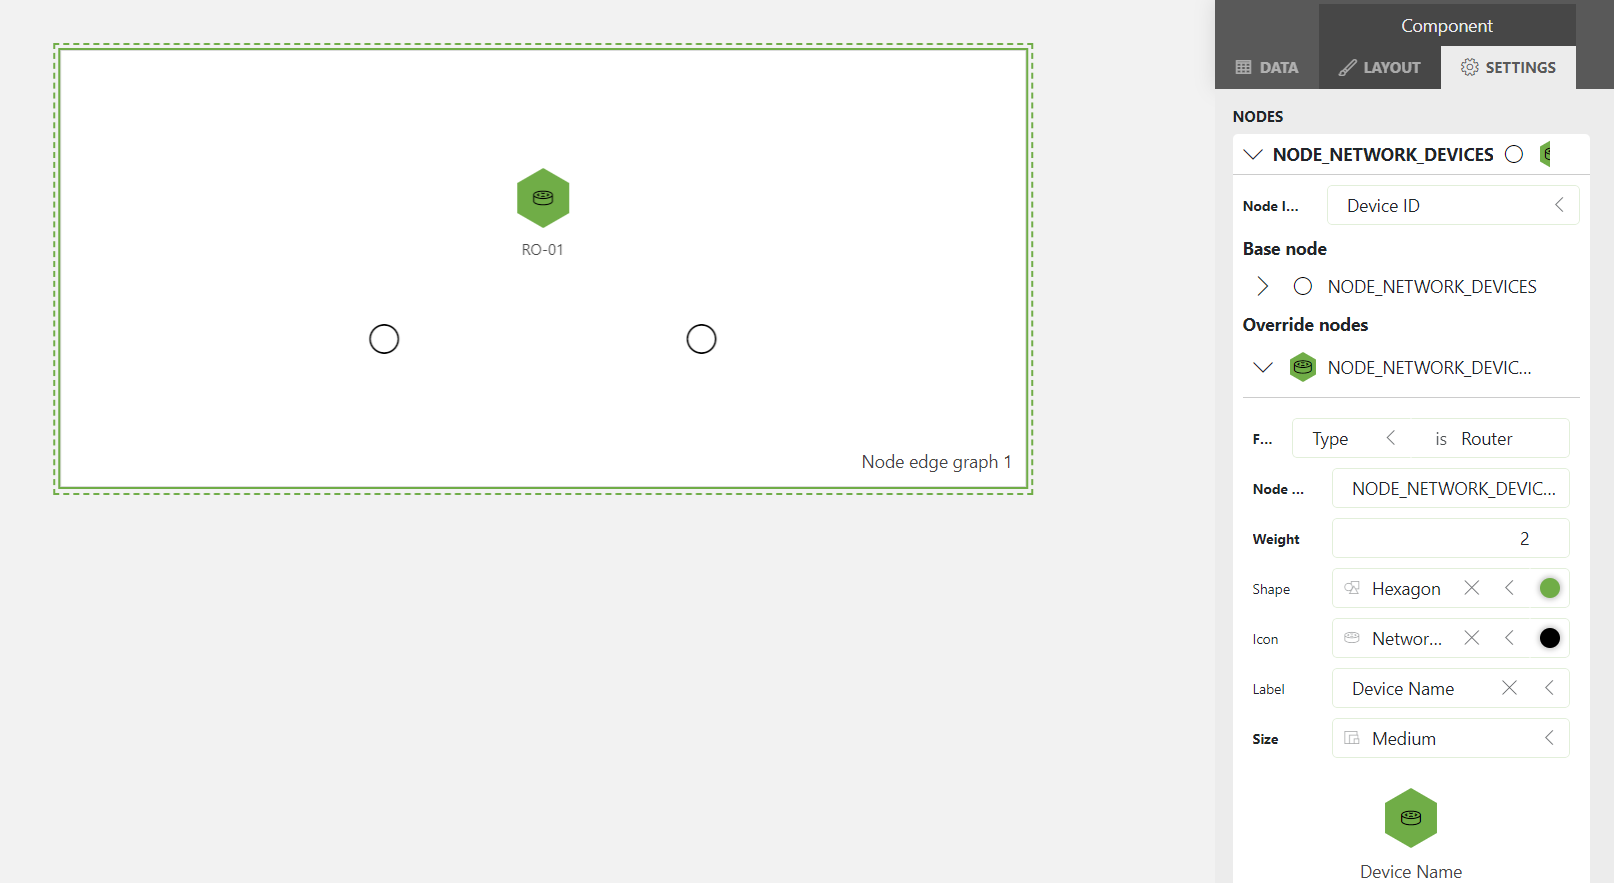
In the Shape box, select Hexagon.
The node representing the router will now have a hexagon shape. Optionally, you can also change the color of the shape by clicking the colored circle to the right of the Shape box.
In the Icon box, change select NetworkDeviceScanning.
Note
To quickly find a specific icon in the list, start typing the name of the icon in the box.
In the Label box, select Device Name.
The name of the device will now be displayed below the node representing the router.
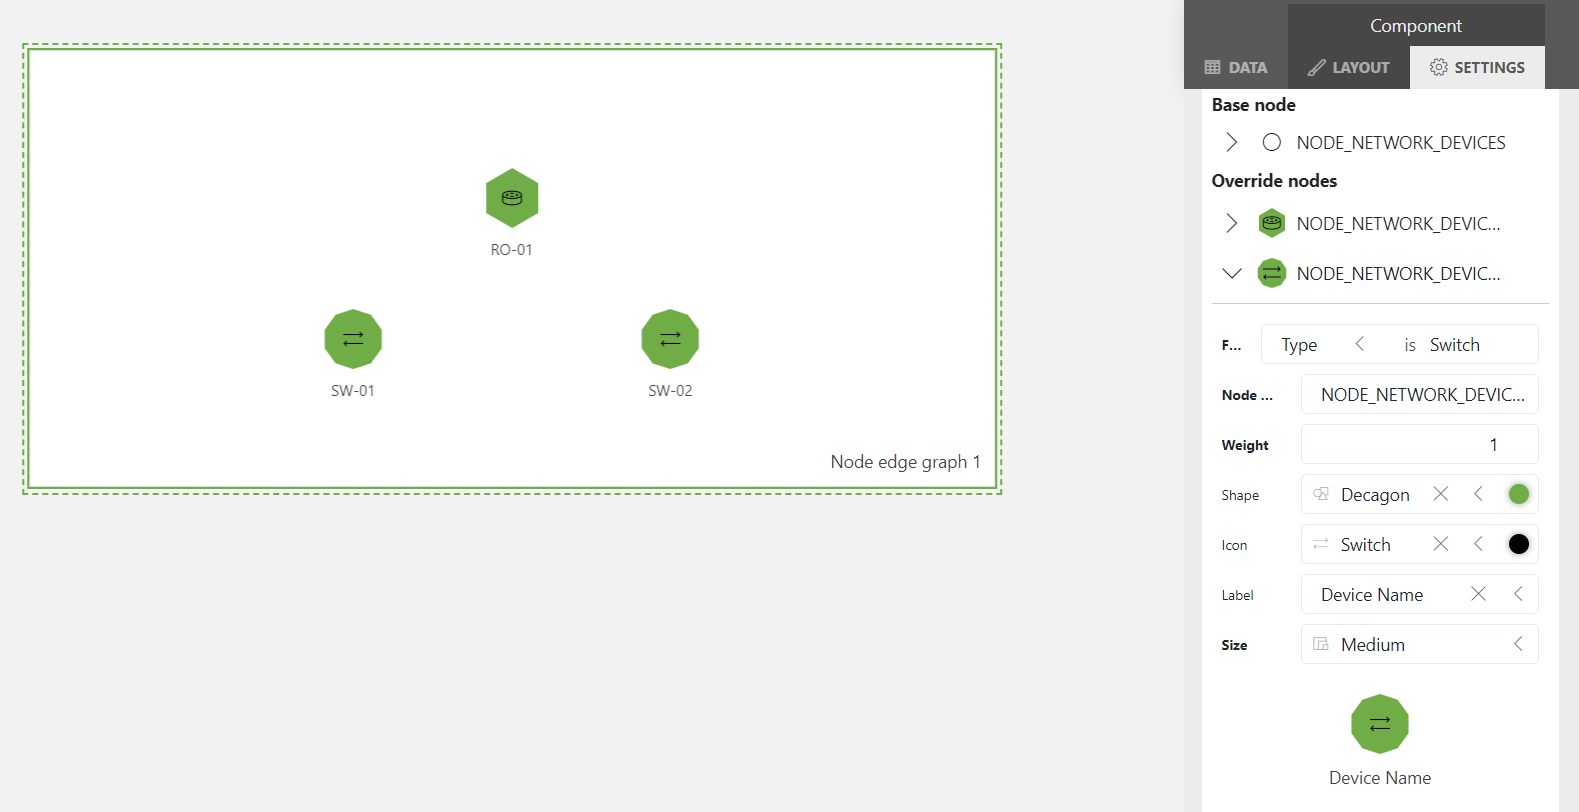
Add an override for the switch nodes:
Click Add Override again.
In the Filter box, select Type, and enter the value
Switchin the box on the right.Keep the Weight set to 1.
This will ensure that the nodes representing the switches are positioned below the router node.
In the Shape box, select Decagon.
The node representing the router will now have a decagon shape. Optionally, you can also change the color of the shape by clicking the colored circle to the right of the Shape box.
In the Icon box, select Switch.
In the Label box, select Device Name.
The nodes should now look like this:
Step 4: Configure the edges between router and switch nodes
At the top of the Unassigned queries list, under the query Edges, select Set as edge.
The query will be moved to the bottom of the pane.
In the Source box, select Source Device ID.
In the Destination box, select Destination Device ID.
The edges connecting the router and switches will now be displayed in the node-edge graph visualization.
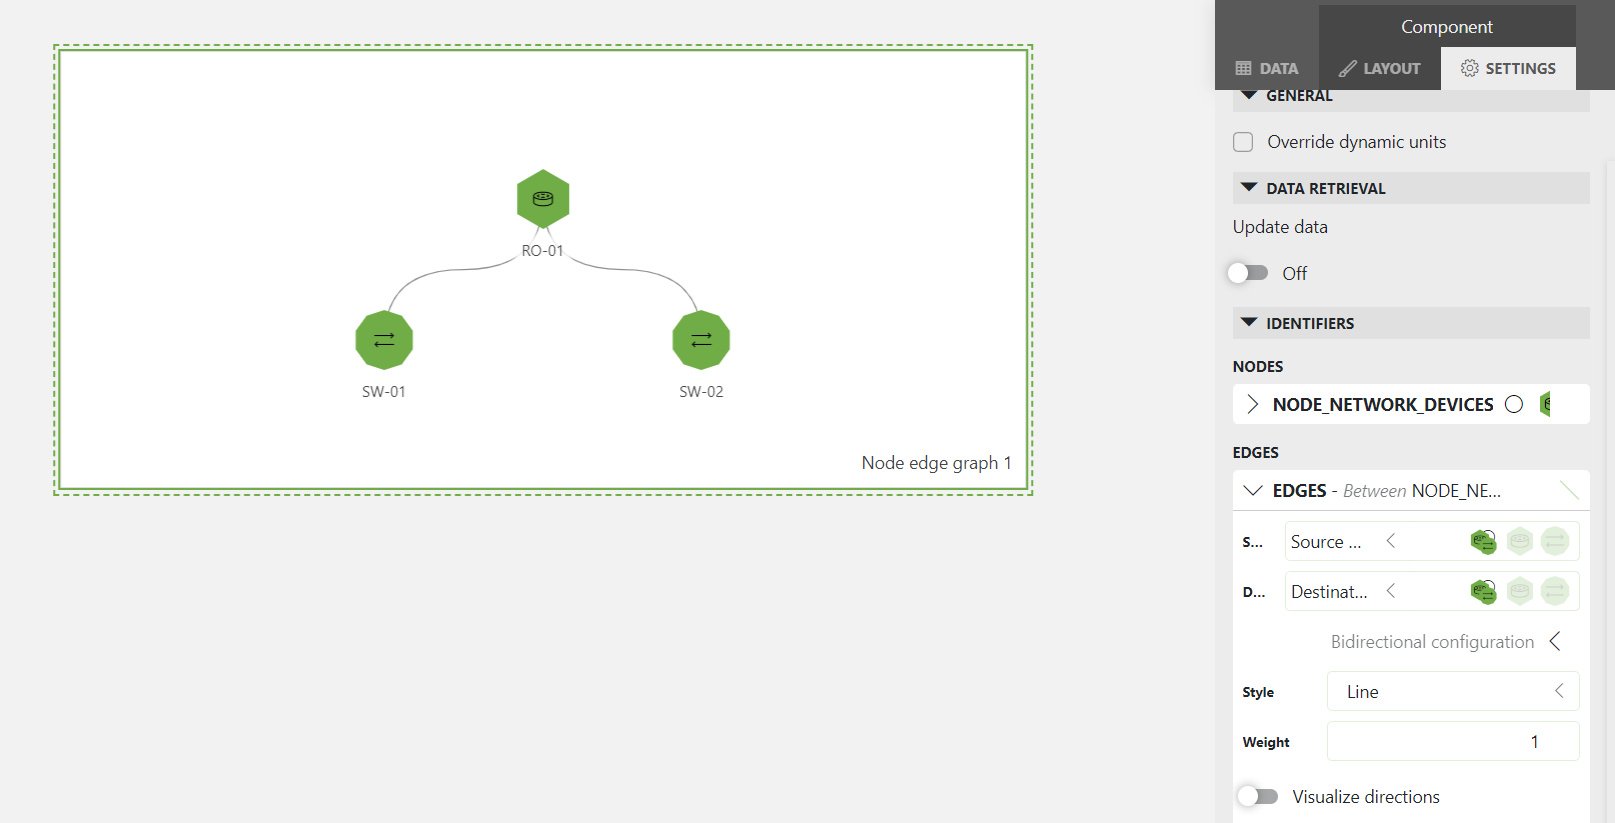
In the Style box, select Dotted.
Enable the toggle button Visualize Directions.
An animation showing the direction of the connection between the switches and the router will now be displayed. The direction will be from switch to router.
Step 5: Add nodes representing PCs
In this step, you will add extra nodes representing PCs to the component. The same Edges query will be used for this, as this query contains the connections between all devices.
From the Data pane on the right, drag the Node_PC query to the node edge graph component.
Click the node edge graph component to select it, and select the Settings pane on the right.
Under Unassigned queries, set the Node_PC query as node.
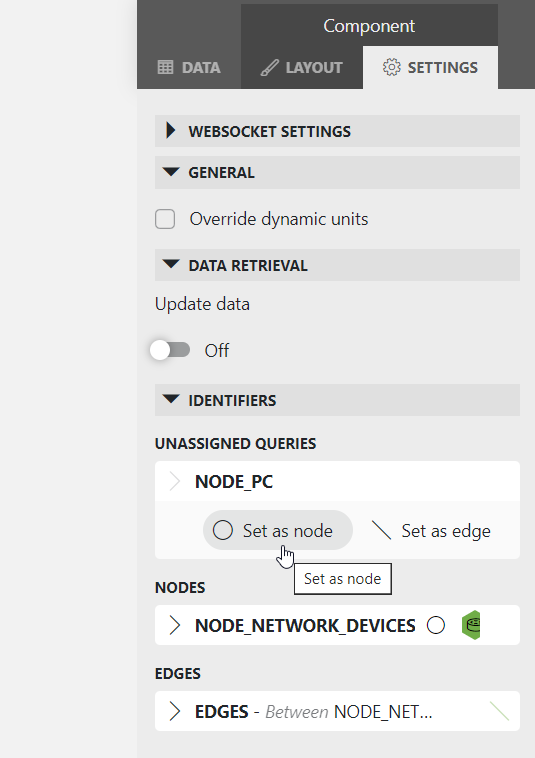
The selected query will be moved below the node query you configured earlier.
For the same query, set Node ID column to the column Device ID.
Six nodes will be displayed in the node edge graph component. By default, the icon displayed for each node is a circle.
Expand the Node_PC base node by clicking the triangle icon next to it.
This will display the list of settings for this node. Instead of overriding this node, you will now update the settings for the base node. This means that all the nodes for this GQI query will be updated in the same way.
In the Shape box, select Circle.
The node representing the PCs will now have this shape. Optionally, you can also change the color of the shape by clicking the colored circle to the right of the Shape box.
In the Icon box, select ThisPC.
In the Label box, select Device Name.
The resulting nodes will look like this:
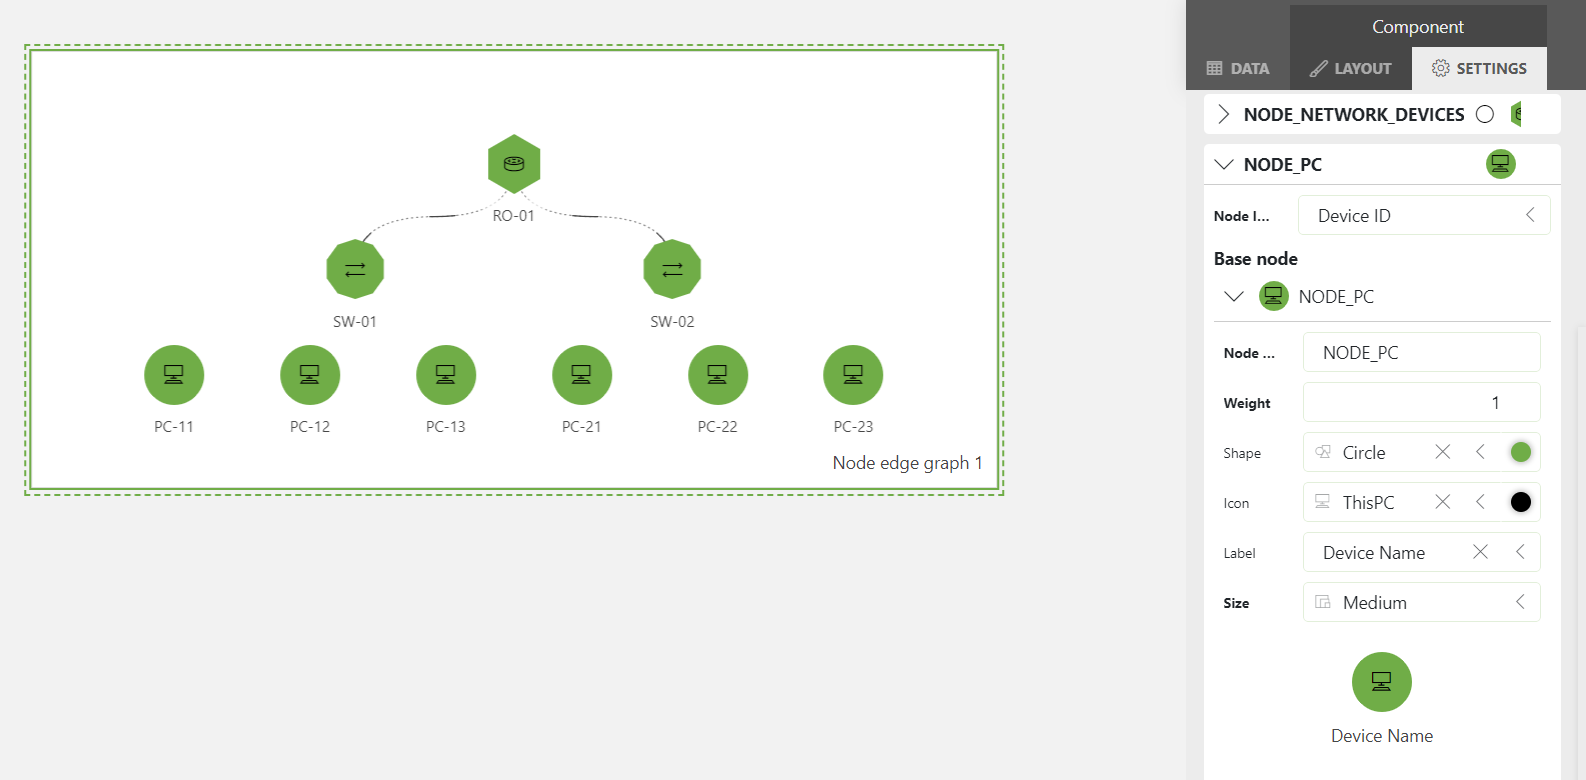
Step 6: Configure the edges connecting the PCs and switches
Since the GQI query Edges contains all the connections between devices in the network diagram, you will need to override the configuration for this query, first for the edges between router and switches, and then for the edges between PCs and switches.
Override the edges between router and switches:
Extend the GQI Query Edges configured Step 2.
The fields Source and Destination will be displayed. Next to these fields, you will see different icons. These represent the nodes configured in the previous steps.
For the Source field, click the icon that is highlighted by default.
This way, the icon will no longer be selected.
Click the icon representing the switches instead.
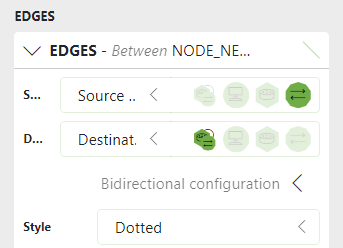
For the Destination field, also click the currently highlighted icon to deselect it, and then click the icon representing the router.
The connections between switches and routers will now be displayed.
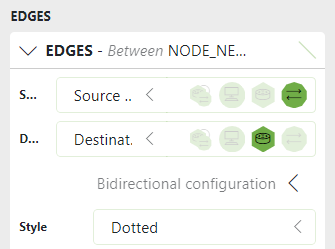
Override the edges between PCs and switches:
At the bottom of the settings pane, click Add Override.
The following setting will be displayed:
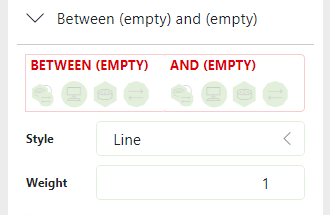
Under Between (empty), select the icon representing the PCs
Under And (empty), select the icon representing the switches
In the Style box, select Dotted
Enable the toggle button Visualize Directions.
An animation showing the direction of the connection between the PCs and the switches will now be displayed. The direction will be from PC to switch. With this, your node edge graph is now complete.