Applying alarm filters in the Alarm Console
Using the Alarm Console quick filter box
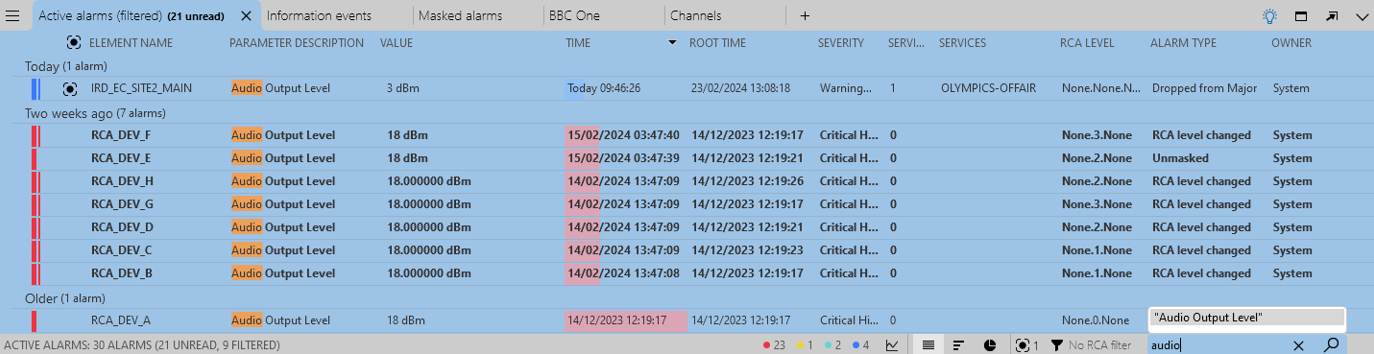
In the lower right corner of the Alarm Console, a quick filter box is displayed.
This filter box can be used in different ways:
Like any other quick filter in Cube, by adding text in the filter box. While you are typing, suggestions will be displayed above the box. When you empty the filter box, or return the focus to the filter box after it had been elsewhere, history items will also be displayed. To search for a suggested word or history item, select it in the list.
Alarm Console in DataMiner 10.4.5Alternatively, it is also possible to add items to the quick filter box, or remove items from the quick filter box, by highlighting them in the Alarm Console. To do so, while pressing the key configured for this in the user settings (by default the left Ctrl key), click on the words you wish to add. You can also press this key and right-click a word to open a context menu with the following options:
Add [highlighted text] to filter
Remove [highlighted text] from filter: Only available if you have already added items to the filter.
Exclude [highlighted text] in filter: This option can only be used on an item that is not yet in the filter, and adds a negative filter for this item. This is the equivalent to adding an exclamation mark in front of an item when you type text in the filter.
Search for [selected text] in new tab: This option opens a new Search alarms tab in the Alarm Console, in which you can search through alarms using this filter. This option is only available on a DMA with indexing database.
Copy [highlighted text]
Clear filter: Only available if you have already added items to the filter.
Tip
See also: Cube settings
When the filter is applied, the alarm tab is displayed with a blue background to indicate that it is being filtered. The total number of alarms is still indicated in the alarm bar, but the number of filtered alarms that are being displayed is added in parentheses.
Using the Alarm Console quick filter buttons
It is possible to quickly filter an Alarm Console tab so that only alarms of a certain severity are shown.
To do so, click the button indicating the relevant severity in the alarm bar.
When the filter is applied, the alarm tab is displayed with a blue background to indicate that it is being filtered. The total number of alarms is still indicated in the alarm bar, but the number of filtered alarms that are being displayed is added in parentheses.
To quickly clear the filter again, click the leftmost field of the alarm bar, indicating the total number of alarms in the tab.
Note
The UI of the Alarm Console adapts to the available space on the screen. If there is sufficient room, the different severity levels shown on the alarm tab will be written in full, with an indication of how many alarms have this severity level. If there is less space, only the severity color and the number of alarms with this severity will be displayed. In very narrow windows, a single button will be displayed, which opens a menu with the different severity levels that can be used for filtering.
Manually applying an alarm filter in an Alarm Console tab
In the Alarm Console, you can add extra tab pages where you can specify a custom alarm filter.
Tip
See also:
- Alarm Console – Advanced filtering on DataMiner Dojo

- Alarm Console – Alarm history on DataMiner Dojo
To add such a filtered tab page:
Click the + symbol in the header of the Alarm Console.
Choose Apply filters or Apply filter and window size, depending on whether you want to see current alarms or history alarms, or alarms in a sliding window.
Specify the time for which alarms need to be retrieved:
For active alarms, skip this step.
For a history alarms, in the From and To boxes, specify the range for which alarms need to be displayed.
For alarms in a sliding window, specify the window size (between 1 minute and 1 day). The default window size is 60 minutes.
Click Select a filter to create or select a filter, then select the field you want to filter on.
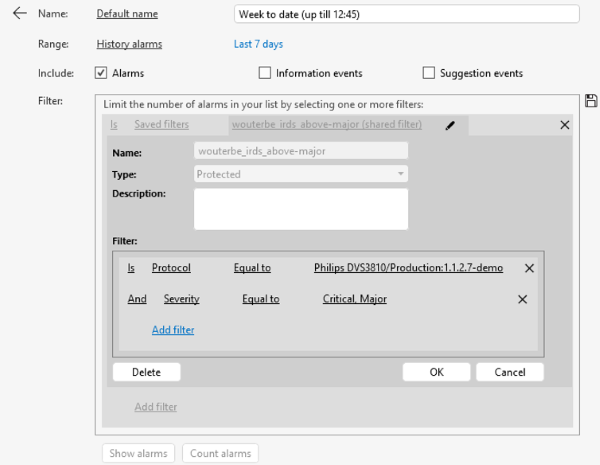
Applying an alarm filter in an Alarm Console tab in DataMiner 10.4.5Note
If any filters have been saved on your DMS, you will be able to choose them in this step. See Working with saved alarm filters.
If you create a new filter, you will then need to specify it further, possibly using a wildcard expression or regular expressions.
Note
- For more information on wildcards, see Searching with wildcard characters.
- For more information on using regular expressions in filters, see Alarm filters using regular expressions.
- To filter the Alarm Console based on a Visual Overview session variable, create a new filtered tab displaying current alarms, and create a filter using Matches wildcard expression, Does not match wildcard expression, Matches regular expression, or Does not match regular expression. In the second part of the filter, specify the variable, in the same way as in Visio, e.g. [var:LoadTime]. For more information, see [var:VariableName].
- If you create a Services filter in a history tab, and you want to include services that have been deleted, at the bottom of the box where you can select services to filter on, select the Load deleted services checkbox (available from DataMiner 10.2.0/10.1.4 onwards).
If you want, you can also combine several filters, using logical operators (AND, OR).
Optionally, limit the types of alarms displayed in the new tab by selecting or clearing the Alarms, Masked alarms and/or Information events checkboxes. These allow you to for example only display information events in the new tab.
Optionally, click Count alarms to check how many alarms will be shown when the tab configuration is applied.
Note
- If you chose to display history alarms, the Count alarms option will only work with certain filter combinations. If you configure a filter combination for which the option is not available, a notification message will appear.
- From DataMiner 10.1.0 [CU8]/10.1.11 onwards, when you create a tab to display history alarms or alarms in a sliding window, for filters on element type, interface impact, parameter description, protocol, service impact, view ID/impact/name, or virtual function ID/impact/name, the Count alarms option is no longer available.
To see the filtered alarms in the Alarm Console tab, click Show alarms.
If you want to change filter settings after the filter has been applied, click the pencil icon next to the alarm tab name.
Creating a search tab in the Alarm Console
When you are connected to a DMA with indexing database, the Alarm Console provides an additional option to create a dynamic search tab:
Click the + symbol in the header of the Alarm Console to open a new tab.
At the top of the tab, next to Search for alarms, do the following:
Add one or more search terms in the search box. As soon as you start typing, suggestions will be displayed below the box.
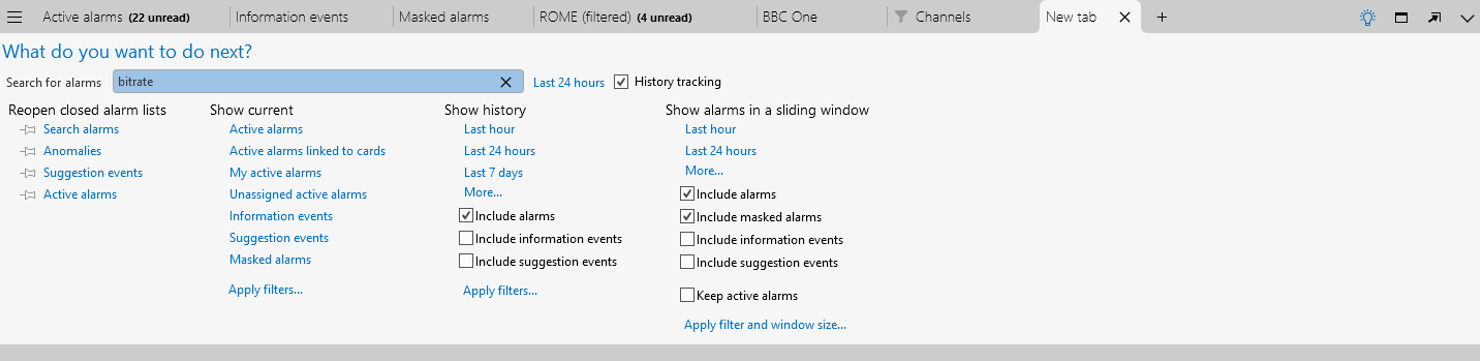
Creating a search tab in DataMiner 10.4.5Next to the search box, indicate the time span in which the alarms should occur. By default, this is set to Last 24 hours.
By default, different instances of the same alarm will be combined in a single alarm tree in the results. If you want them to be displayed separately instead, disable the History tracking checkbox.
Press Enter or select a suggestion to begin the search. The alarms matching your search phrase will then be retrieved in batches of 50. If there are more than 50 alarms matching the search phrase, a More results button will be displayed at the bottom of the list.
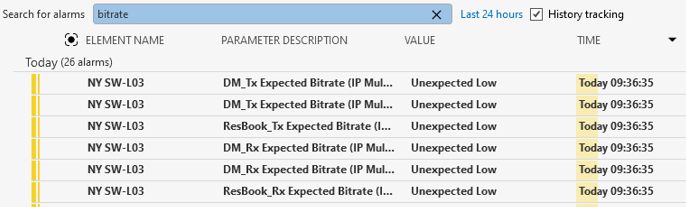
Search tab in DataMiner 10.4.5
Once the first 50 alarms have been retrieved, a graphical representation of the alarm distribution will be displayed at the bottom of the tab.
Special keywords in the search tab
In the search box, you can use the following special keywords, followed by a colon (":") and a search phrase:
Severity
Description
Parameter_description
Owner
Value
Time of arrival
Status
Elementname
Viewnames
Parentviews
Protocolname
ElementProperty_<propertyName>
Viewproperty_<PropertyName>
ServiceProperty_<PropertyName>
For example, if you want to search alarms associated with elements of which the name resembles "probe", then you can enter "Elementname:probe".
Filtering alarms on alarm focus
The DataMiner Analytics software assigns an estimated likelihood or "alarm focus score" to each alarm, after analyzing the short-term history and current behavior of incoming alarms in real time. The alarm focus score is based on a combination of likelihood, frequency, and severity.
Likelihood scores are used to spot daily patterns. If an alarm occurs at the same time every day, it will be assigned a high likelihood value at that time.
Frequency scores are used to detect parameters that frequently go into and out of alarm, or alarms that persist over a long time.
Depending on the focus score, an alarm can be considered unexpected. In that case, this is indicated with the following icon in the Focus column: 
To filter the alarm list to only show such unexpected alarms, click the following button in the alarm bar: 
Note
- From DataMiner 10.2.0 [CU21]/10.3.0 [CU9]/10.3.12 onwards, the focus icon is only visible in the alarm bar when the Active alarms tab contains focused alarms.
- From DataMiner 10.2.0 [CU21]/10.3.0 [CU9]/10.3.12 onwards, a number is displayed next to the focus icon in the alarm bar, indicating the number of focused alarms in the Active alarms tab.
Please note the following regarding the alarm focus feature:
This feature is only available if your DataMiner System uses Storage as a Service (recommended) or a self-managed Cassandra-compatible database.
The focus icon in the alarm bar is only displayed on tabs displaying active alarms.
Likelihood values are based on UTC time. As a result, when daylight saving time goes into or out of effect, patterns following local time might be off for approximately one week.
Currently, no focus score is assigned to the following types of alarms: Correlation alarms, external alarms and information events.
If an alarm template changes, all alarms of the parameters for which a change was implemented in the alarm template will be treated as unexpected.
In case of an alarm storm, the update of focus scores of persistent alarms is postponed until after the alarm storm ends.
A model is created in DataMiner for every parameter that has had an alarm in the last two weeks, up to a limit of 100 000 models. This upper limit is rarely ever reached, but when it is, the notice "Alarm Focus has reached its maximum cache size" is displayed in the Alarm Console, and all alarms on parameters that have no model yet will be marked as unlikely. This notice will not influence any other part of the system and can be safely ignored. However, if you see this notice regularly, it can be a sign that your parameters are not spread optimally over your DataMiner System, or that one of your protocols is generating alarms on many different rows in a table.
Note
You can enable or disable the alarm focus feature via System Center > System settings > analytics config. However, note that if you disable alarm focus, automatic incident tracking is automatically also disabled, and only manual incident tracking can still be used.
Applying an alarm filter by dragging an item onto the Alarm Console
Instead of manually applying a filter in a tab, you can also drag an item from the Cube UI onto the Alarm Console to create a tab filtered specifically for that item.
Tip
See also: Alarm Console – Alarm history on DataMiner Dojo
To do so:
Drag an element, protocol, parameter, etc. onto the Alarm Console. A new tab will automatically be created.
Note
- With a redundancy group, this way of creating a filtered tab is not possible.
- To open a filtered tab for an element, service or view, you can also right-click the item in the Surveyor or on a card and select Actions > Add tab to global Alarm Console.
In the new tab, indicate the time frame for the alarms you want to display: active alarms, or a past time range.
In the What column, select whether to show non-masked alarms, information events and/or masked alarms.
In the next column, select the items to filter on.
The options in this step differ depending on the type of item you dragged onto the Alarm Console. E.g. for a parameter, you may be able to click Load more elements, so that you can select several elements that have this parameter.
Click Show alarms.
Note
- Alarm filters based on views also include alarm events based on aggregation rules.
- If you want to open a filtered tab containing only alarms related to a particular DMA, this is possible from the System Center module. Go to the Agents page of System Center and select the DMA in question in the manage tab. Then click the Show agent alarms link at the top of the pane on the right. The filtered tab will then be opened in the Alarm Console. It will show all alarms on the DMA itself with severity Notice, Timeout or Error.
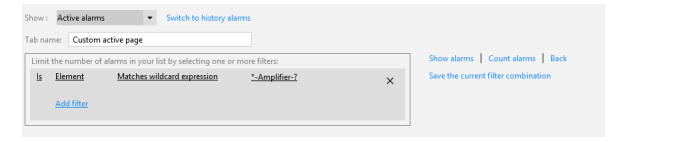
Alarm filters using wildcard expressions
The example below shows a filter for elements matching a particular wildcard expression.
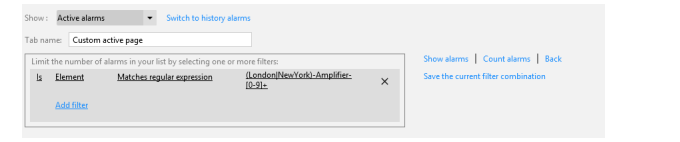
Alarm filters using regular expressions
If you want to filter alarms using a regular expression:
When creating a filter, select the Matches Regular Expression operator.
Specify a regular expression.
Regular expression syntax
You can use any regular expression.
For more information on how to construct regular expressions, here are a few interesting links:
Note
- DataMiner always wraps a regular expression in ^( and )$. This means that the expression must match the entire string.
- The checks are executed using the invariant culture and ignoring case.
Regular expression examples
London.*
Matches ...
London-Amplifier-1
London-Amplifier-2
Does not match ...
NewYork-Amplifier-1
East-London-Amplifier
Paris-Amplifier
(London|NewYork)-Amplifier-[0-9]+
Matches ...
London-Amplifier-1
NewYork-Amplifier-5
Does not match ...
Paris-Amplifier-7
London-Amplifier-XYZ
MAC-^([0-9A-F]{2}[-]){5}([0-9A-F]{2})
Matches ...
- MAC-A0-12-EF-DE-A1-C3
Does not match ...
- MAC-99-99-99-99-99
Working with saved alarm filters
When you create a filter in the Alarm Console, you can save it in order to use it again later or in other DataMiner applications.
Saving an alarm filter
Create a filter as described in Manually applying an alarm filter in an Alarm Console tab.
Before clicking Show alarms to apply the filter in the tab, click Save the current filter combination.
Note
If the current filter combination contains a private alarm filter, it will not be possible to save the filter combination as a public or protected filter.
Enter a name for the alarm filter.
Note
Alarm filters may not start or end with a space.
Indicate whether the filter should be private, public, or protected. See Alarm filters
Optionally, add a description.
Click Save.
Using a saved alarm filter
Create a filtered tab as described in steps 1 and 2 in Manually applying an alarm filter in an Alarm Console tab.
When you select a filter, as described in step 3 of the same procedure, scroll to the bottom of the list and select Saved filters.
To the right of Saved filters, click <Click to select> and select the filter you want.
Note
If you have selected a saved filter, but you do not have the user permission Edit / delete protected filters, an eye icon will be displayed next to the filter. Click this icon to view the contents of the filter.
Proceed as in Manually applying an alarm filter in an Alarm Console tab.
Editing or deleting a saved alarm filter
Select the filter from the Saved filters as if you were going to use it.
Click the pencil icon to the right of the filter.
In the edit window, the following actions are possible:
Click the Delete button to delete the alarm filter. You will receive a warning message mentioning where the filter may be used.
Note
It is not possible to delete an alarm filter that is currently in use.
Enter a description for the filter in the Description field.
Change the fields of the filter itself, or delete parts of a combined filter, in the same way as when creating a new filter.
To save any changes, click OK.