Working with trend patterns in DataMiner Cube
This tutorial showcases DataMiner's pattern matching feature. You will first learn how to select a time range where multiple parameters exhibit a recurring pattern and create a trend pattern, which will help provide context information in your trend graphs. Then you will find out how you can avoid having to create the same pattern several times for different elements using the same protocol or for different rows in a table. Finally, you will learn how to work with pattern events in the Alarm Console, as well as how you can clean up the patterns that have been created in the system.
This tutorial will make use of history sets to establish the parameters' normal behavior, enabling DataMiner to detect unexpected behavior. Trending is enabled on all parameters used in this tutorial.
The content and screenshots for this tutorial have been created in DataMiner 10.4.8.
Estimated duration: 20 minutes.
Prerequisites
DataMiner 10.3.8 or higher with Storage as a Service (STaaS) (recommended) or a self-managed Cassandra-compatible database and indexing database.
Pattern matching is enabled (in DataMiner Cube: System Center > System settings > analytics config).
Overview
The tutorial consists of the following steps:
Step 3: Configure a pattern for all elements with the same protocol
Step 4: Configure a multivariate pattern for all rows in a table
Step 1: Install the example package from the Catalog
Go to https://catalog.dataminer.services/details/aee71207-bd32-49d2-a87b-e31078e6ea5a.
Deploy the Catalog item to your DataMiner Agent by clicking the Deploy button.
This will create four DataMiner elements, named "PM Video Server 1", "PM Video Server 2", "PM Tables", and "PM Event Creator" in your system, which will be used throughout the rest of the tutorial. The elements will be located in the view DataMiner Catalog > KATA Working with Pattern Matching in Trend Graphs.
Step 2: Add context to a trend graph
In the DataMiner Cube Surveyor, select the element PM Video Server 1.
This element provides information about the available physical memory, CPU load, free disk space, and video feed of a fictional server.
On the General data page of the element, next to the CPU Load parameter, click the trend icon.
Depending on the detected trend behavior, this icon can be an arrow icon, or it can look like this:
 .
.In the top-right corner of the trending page, select Week to date to inspect the trend data for the past week.
You will see some CPU spikes that look similar. However, these may not have the same cause. To investigate further, some extra parameters need to be added to the trend graph.
Add the parameters Free Disk Space, Available Physical Memory, and Video Feed to the trend graph:
In the lower right corner, click the expand icon
 to expand the parameter pane.
Click Add parameter.
Specify the parameter.
Repeat the previous two steps until all the necessary parameters have been added.
Click Show trend.
Tip
See also: Working with the parameter pane
The graph will now show two different CPU Load spikes:
- The first one coincides with a significant drop in the Free Disk Space, which happens during a backup.
- The second is a downward spike in the Available Physical Memory coinciding with an upward spike in the Video Feed.
Create a multivariate pattern for the backup behavior:
Select the section of the graph where you see this recurring behavior.
The way you can do so depends on the configuration of the trending user settings. See Trending settings.
Click the tag icon and then click the cogwheel icon.
Enter the name Backup.
Clear the checkboxes for the Available Physical Memory and Video Feed subpatterns.
You can scroll in the Patterns area to see all the subpatterns.
Click OK.
Tip
See also: Defining a pattern
Create a multivariate pattern for the recurring behavior where a downward spike in the Available Physical Memory coincides with an upward spike in the Video Feed:
Select the section of the graph where you see this recurring behavior, in the same way as before.
Click the tag icon and then click the cogwheel icon.
Enter the name Video Feed.
Clear the checkbox for the Free Disk Space subpattern.
Click OK.
In the top-left corner, click Up to Data Display.
Click the trend icon next to the CPU Load parameter again.
In the top-right corner of the trending page, select Week to date.
You will now see that context information is available for the different CPU spikes. The multivariate icon ![]() indicates that the pattern combines trend information from different parameters. Clicking this icon will load all trend graphs of the parameters that are part of the pattern. Hovering the mouse pointer over the tag will highlight all trend lines that are part of the pattern.
indicates that the pattern combines trend information from different parameters. Clicking this icon will load all trend graphs of the parameters that are part of the pattern. Hovering the mouse pointer over the tag will highlight all trend lines that are part of the pattern.
Step 3: Configure a pattern for all elements with the same protocol
In the Surveyor, select the element PM Video Server 1.
Click the trend icon next to the CPU Load parameter.
In the top-right corner of the trending page, select Week to date.
Click the tag button above the pattern Video Feed.
Click the pencil icon and then click the cogwheel icon.
For all subpatterns, click the element name next to Apply to and select protocol instead.
Tip
See also: Editing a pattern
Click OK.
In the Surveyor, select the element PM Video Server 2.
Click the trend icon next to the CPU Load parameter, and click Week to date.
You will see that the Video Feed pattern is indicated, but the Backup pattern is not.
Step 4: Configure a multivariate pattern for all rows in a table
In the Surveyor, select the element PM in Tables.
This element provides information about the CPU usage and free disk space of multiple fictional servers in a table.
In the Server overview table, click the trend icon in the CPU Usage column and the Server 1 row.
In the top-right corner of the trending page, select Month to date.
Add the Free Disk Space parameter to the trend graph:
In the lower right corner, click the expand icon
to expand the parameter pane.Click Add parameter.
Select the parameter Server overview: Free Disk Space.
Click Show trend.
Create a multivariate pattern for the Backup behavior:
Select the section of the graph where you can see this recurring behavior.
Click the tag icon and then click the cogwheel icon.
Enter the name Backup. The pattern name does not have to be unique.
For all subpatterns, next to Apply to, click single row '...' and select all rows instead.
Click OK.
Click Up to Data Display in the top-left corner.
In the Server overview table, click the trend icon in the CPU Usage column and the Server 4 row.
In the top-right corner of the trending page, select Month to date.
You will see that the Backup pattern is marked where relevant.
Step 5: Create pattern events
Select the element PM Event Creator in the Surveyor.
This element provides information about the power consumption of a fictional server.
On the General data page, click the trend icon next to the Power Consumption parameter.
Zoom in on the spike at the beginning of the trend data.
Tip
See also: Zooming in/out on a trend graph
Create a univariate pattern for the power spike behavior:
Select the section of the graph where you see the power spike.
Click the tag icon.
Enter the name Power spike.
Click the check mark icon.
Click Up to Data Display in the top-left corner.
Click the Generate Pattern button to generate a new power spike.
Click the trend icon next to the Power Consumption parameter.
Wait until the new tag appears for the new power spike. Zoom in if necessary to better see the spike.
If the Alarm Console is not yet expanded, in the lower right corner of the Cube window, click the expand icon
to expand it.In the top-right corner of the Alarm Console, click the light bulb icon.
This icon lights up in blue to indicate that DataMiner Analytics has found something interesting. For more detailed info, see Working with the Alarm Console light bulb feature.
Click the menu item 1 recent pattern occurrence detected.
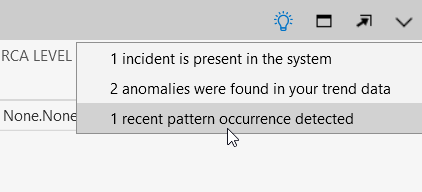
A new Patterns tab will now be shown in the Alarm Console, listing the pattern that were detected.
Step 6: Clean up patterns
Select the element PM Video Server 1 in the Surveyor.
On the General data page, click the trend icon next to the CPU Load parameter.
Right-click the trend graph and select Trend Patterns.
This will open an overview of all the patterns available for the parameter.
Select the checkbox Show all patterns to have an overview of all patterns in the system.
Click the garbage can icon next to each pattern to delete the patterns.

Important
We want to keep improving our pattern matching feature, and your feedback is very helpful for this. That is why you can also earn DevOps Points by sending us examples of patterns that are valuable for your operations and/or situations where pattern matching can be improved (e.g. the feature did not perform as well as you had hoped).
Use the following email format to send us your examples:
- Subject: Tutorial - Pattern matching feedback
- To: ai@skyline.be
- Body:
- Dojo account: Clearly mention the email address you use to sign into your Dojo account, especially if you are using a different email address to send this email.
- Feedback: Provide a short explanation of what is shown in the examples you are sending us and why relation learning was useful or not.
- Attachment: A screenshot relevant to your use case
Skyline will review your submission. Upon successful validation, you will be awarded DevOps Points.