Working with the parameter pane
In the parameter pane, you can add as many parameters as needed to create a particular trend group. Parameters can also be duplicated or deleted in the pane.
Additionally, it functions as a graph legend for the main graph area. As you move the mouse over the graph, the timestamp of the trace point as well as the trace value of every parameter is shown, even when the pane is collapsed. When the pane is expanded, it will also display the average, minimum and maximum value of the parameter at that point in time.
To add parameters with the parameter pane:
Click Add parameter or drag an element or parameter onto the graph from the navigation pane.
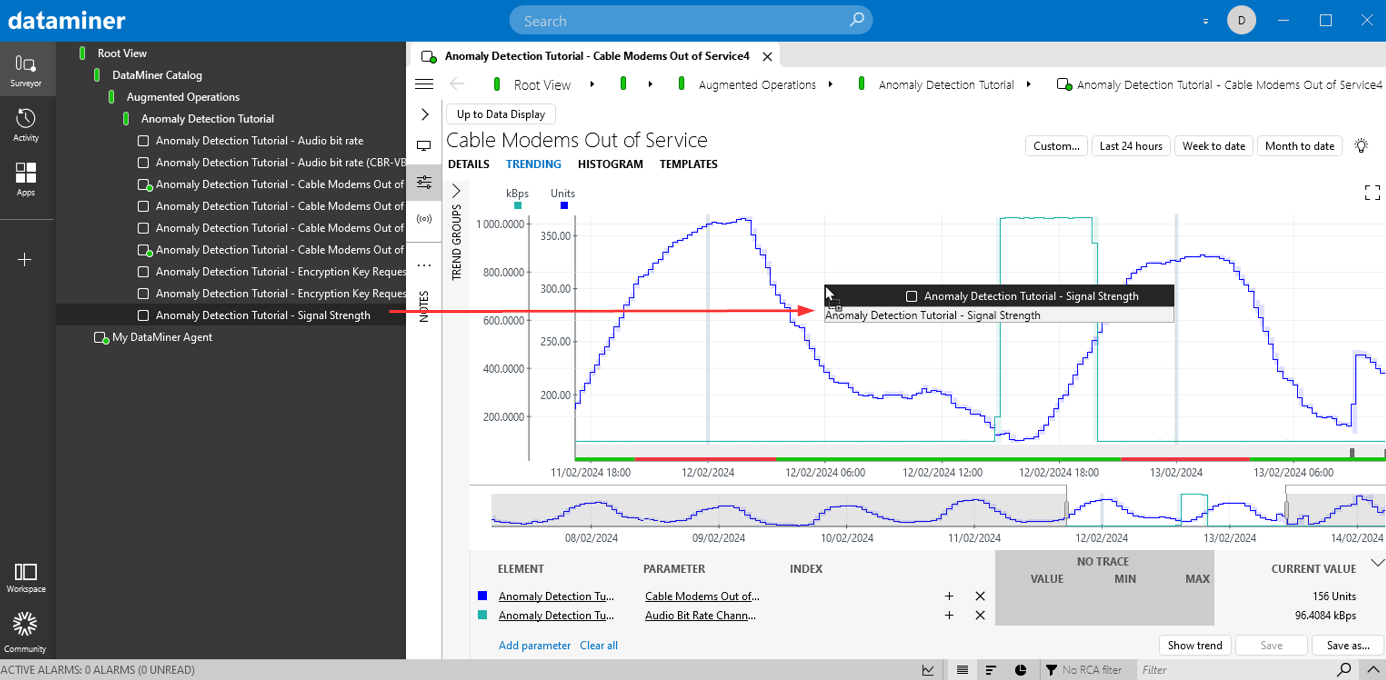
Trend graph in DataMiner 10.4.5Specify the element and parameter, if necessary. For a table parameter you may also need to specify the index.
Repeat from step 1 until all necessary parameters have been added.
To save the trend group, click Save as. For more information on adding a trend group, see Adding a trend group.
The following functionalities may also be useful:
By default, when you add a new parameter, the parameter at the bottom of the list will be duplicated. However, to add a parameter similar to a different parameter in the list, you can duplicate it with the + icon to the right of the parameter.
To remove one of the parameters in the pane, click the x icon to the right of the parameter.
To view the added parameters in the trend graph, click Show trend.
To start over and remove all added parameters, click Clear all.